Browse categories
Explore
Fiverr Pro
English
$
USD
I will create a dynamic Power BI report with advanced DAX
Are you struggling to make sense of your sales data? I will build you a professional, interactive Power BI sales dashboard that turns raw numbers into clear business decisions.
Whether you are a sales manager, retail business owner, or analyst this dashboard will give you instant visibility into what's selling, where, and when.
What You Will Get:
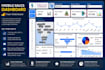
Dynamic KPI cards Total Revenue, Units Sold, Average Selling Price, and Growth % Regional map visual showing geographic sales performance Top brands and products ranked by revenue (with automatic highlighting) Time intelligence pages MTD, QTD, and YTD trend analysis Month-over-Month growth tracking with conditional formatting Clean, app-like navigation using bookmarks and buttons Star schema data model for fast, accurate performance Fully interactive slicers filter by region, brand, time period, and more
Tools & Techniques Used: Power BI Desktop | DAX (RANKX, YTD, MTD, MoM%) | Power Query | Star Schema Modeling | Excel
What I Need From You: Your sales data in Excel or CSV format. If you don't have data ready, I can work with sample data and customize it to your business.
Why Work With Me? I have built real-world Power BI dashboards


Expertise:
Business Insights
•
Factor analysis
Technology:
Excel
•
Google Sheets
•
Power BI
•
Tableau
Programming language:
SQL
What type of sales data do you have?
Excel file (.xlsx) CSV file Google Sheets
What are the main KPIs or metrics you want to track?
Total Revenue, Units Sold, Monthly Growth, Regional Performance, Top Products)
How many pages/views do you need in the dashboard?
1 page (Basic) 2–3 pages (Standard) 4–5 pages (Premium) Not sure, suggest what's best
Please share your data file and describe your business briefly.
(Example: mobile retail store, e-commerce brand, distributor — so I can customize the dashboard to your industry)


