Browse categories
Explore
Fiverr Pro
English
$
USD
Not sure if your business is on track until the month is already over?
Without a clear Budget vs. Actual view, overspending and missed targets can go unnoticed until it's too late to take action.
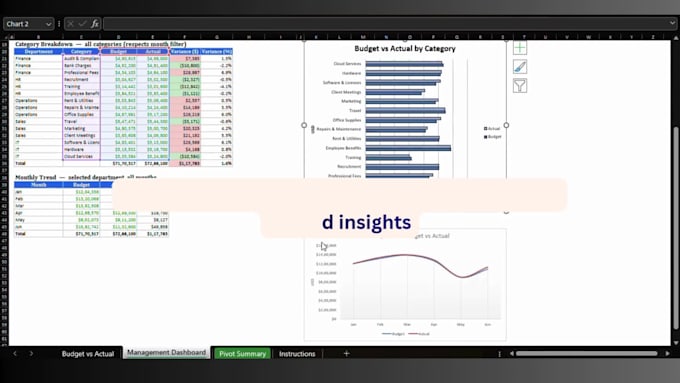
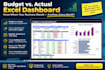
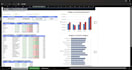
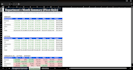
I build automated Excel dashboards that compare budgeted numbers with actual spend/revenue, department by department, with clear variance highlights.
What you get:
I regularly work with financial reporting and Excel-based MIS dashboards in my finance role, so the dashboards are designed around practical reporting needs, not just generic templates.
How to order: Choose the package based on your department count. Not sure which fits? Pick Basic and place your order, or message me first with your requirements and I'll guide you to the right package.
Visualization tools:
Microsoft Excel
Service type:
Budget Vs. actual analysis
Target country:
India
•
United Kingdom
•
United States
What format do you need my budget and actual data in?
An Excel or CSV export works perfectly from Tally, SAP, QuickBooks, or even a manual spreadsheet you already use. No special formatting needed on your end.
Can I update this myself every month once it's delivered?
Yes. Standard and Premium packages include a reusable template plus a simple instructions sheet, so you can plug in new numbers each month without needing me again.
Do you need access to my accounting software or bank accounts?
No. I only need the exported data (Excel/CSV) — no login access to any of your systems is required.
Can you handle multiple currencies or multiple business entities?
Yes, that's usually a small customization. Please message me with details before ordering so I can quote it accurately.
What if I don't know my exact number of departments yet?
No problem - just place your order and answer the requirements questions as best you can. I'll follow up if I need any clarification.
Will the dashboard update automatically when I add new data?
The core structure is fully formula-driven, so once you paste in new data, calculations and variance flags update instantly. You just refresh the pivot/chart view (I'll show you how in a short walkthrough).