Browse categories
English
$
USD
Connect to your AI

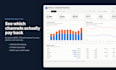

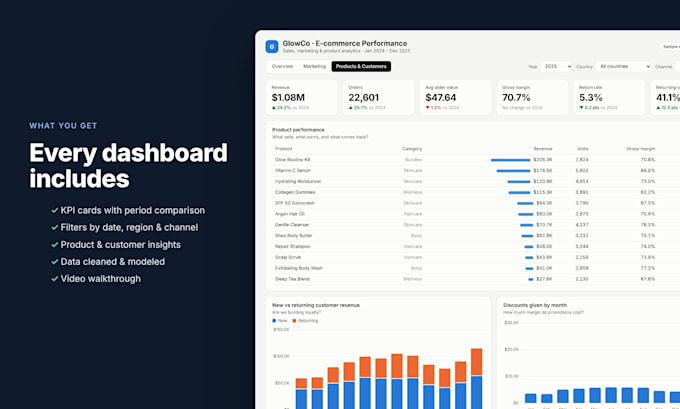
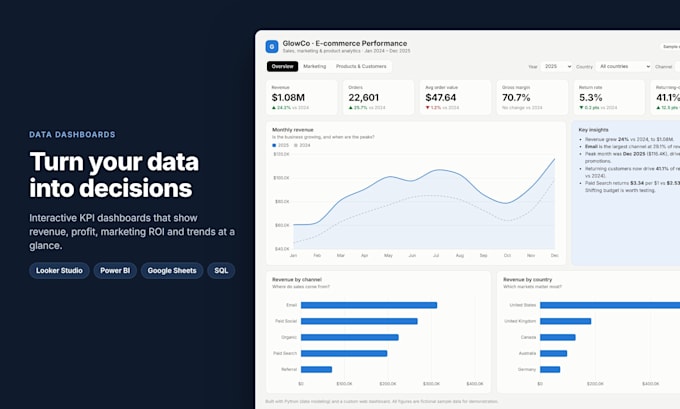
Tired of digging through spreadsheets to understand how your business is doing?
I'll turn your raw data into a clean, interactive dashboard that shows what matters at a glance: revenue, profit, customers, marketing ROI, and trends.
What you get:
KPI cards with period-over-period change
Interactive filters (date, product, channel, region)
Clear charts designed for decision-making, not decoration
Data cleaned and modeled correctly
Short video walkthrough of your dashboard
Data sources: Google Sheets, Excel/CSV, Google Analytics 4, Shopify, Google/Meta Ads, SQL databases (PostgreSQL, MySQL, BigQuery).
Why me: I'm a full-time data analyst in the marketing analytics team of a large global company, where I build dashboards senior leaders rely on. I start by understanding your business, then pick the KPIs that actually drive decisions, making sure numbers are correctly presented. Backed by a Statistics & Data Science degree from IIT Kanpur.
Not sure which package fits? Message me with your data and goal, and I'll suggest the right scope before you order.
Analytics Engineer
Languages
Is my data safe?
Your data is used only for your project and deleted after delivery on request.
Can it update automatically?
Yes. The Premium package connects live sources so the dashboard refreshes by itself.
What if my data is messy?
Data cleaning is also included in all packages, so don't worry