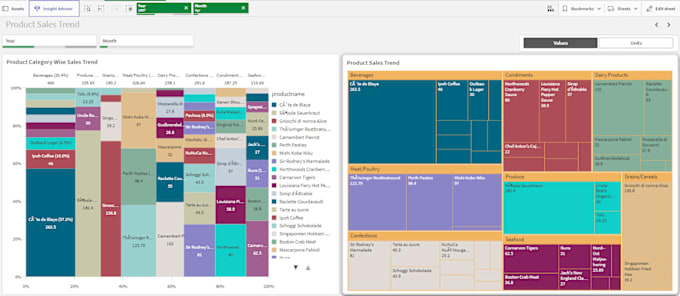
I can create all types of visualization available in Qlik Sense,
- I can create Line Chart, Pie Chart, Area Chart, Scatter Plot, Histogram, Heatmap, Bubble Chart, Waterfall Chart, Box Plot, Donut Chart.
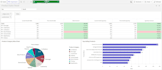
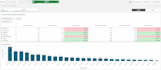
- I can create dashboards with multiple resources which would update data on daily basis as the source is updated
- I can create reports with complex calculations
- I can write scripts to load data from multiple sources, joining them and maintaining the data model
Drop me a message before ordering so we can discuss your requirements,
Let Data Determine your Future.