Browse categories
English
$
USD
Connect to your AI

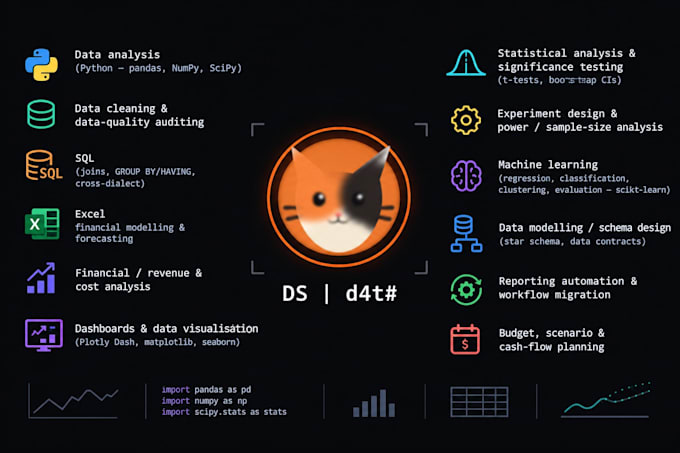

You have data in a spreadsheet that nobody opens. I will build the dashboard that changes that.
Public examples of my work both built on synthetic data, so no client information is involved:
- saas-revenue-analytics.onrender.com subscription revenue, churn and segmentation
- holding-360.onrender.com cash and margin consolidation across three companies
Both are Python and Plotly Dash, with tests and a documented data model.
What you get:
- An interactive dashboard: filters, KPI cards and the charts that answer your question
- Clean, tested Python code that you own (pandas + Plotly Dash)
- A short README so anyone on your team can run it locally
- Deployment guidance free-tier hosting is perfectly adequate to start
One honest note: the free hosting tier on my own demos sleeps after 15 minutes idle, so the first
load can take about 15 seconds. On your own hosting that does not happen.
Data Scientist, Machine Learning Analyst, Senior Data Analyst
Languages
