Browse categories
Explore
Fiverr Pro
English
$
USD



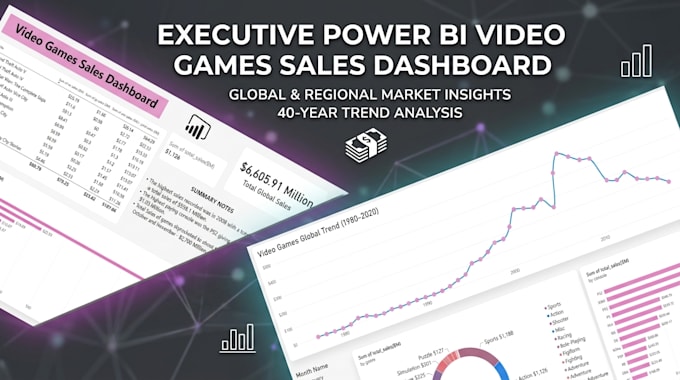
Tired of digging through spreadsheets to understand how your business is performing?
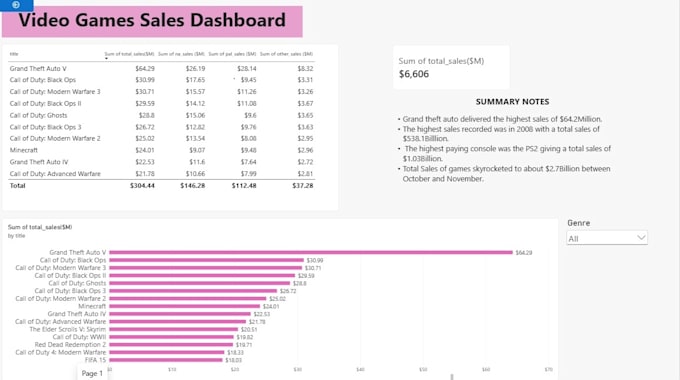
Ill turn your raw or messy data into a clear, interactive Power BI dashboard that makes your key insights easy to understand.
What I Can Help With:
Ready to turn your data into useful insights? Send me a message and let's get started!
Excel Data Analyst
Languages
Do I need to have my data completely clean before sending it to you?
Not at all! I use Power Query to handle the heavy lifting. I’ll clean, format, and structure your messy raw Excel or CSV files so they work seamlessly in the report.
Will I be able to interact with the dashboard myself?
Yes! Every chart, slicer, and filter is fully interactive. You’ll be able to click on specific regions, years, or categories to dynamically filter your entire view in real-time.
What do you need from me to get started?
Just send over your dataset (Excel, CSV, Google Sheets, etc.) along with a short note about your goals or key metrics. I'll take care of the rest!