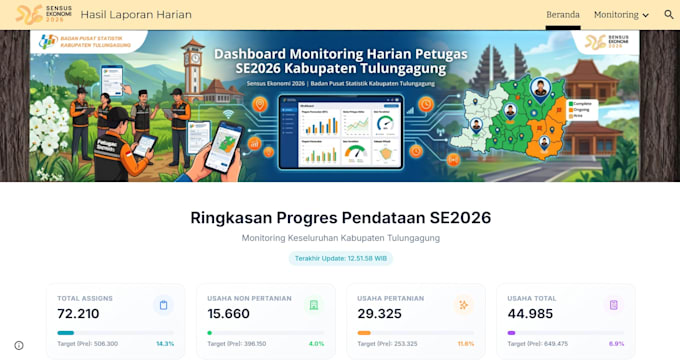
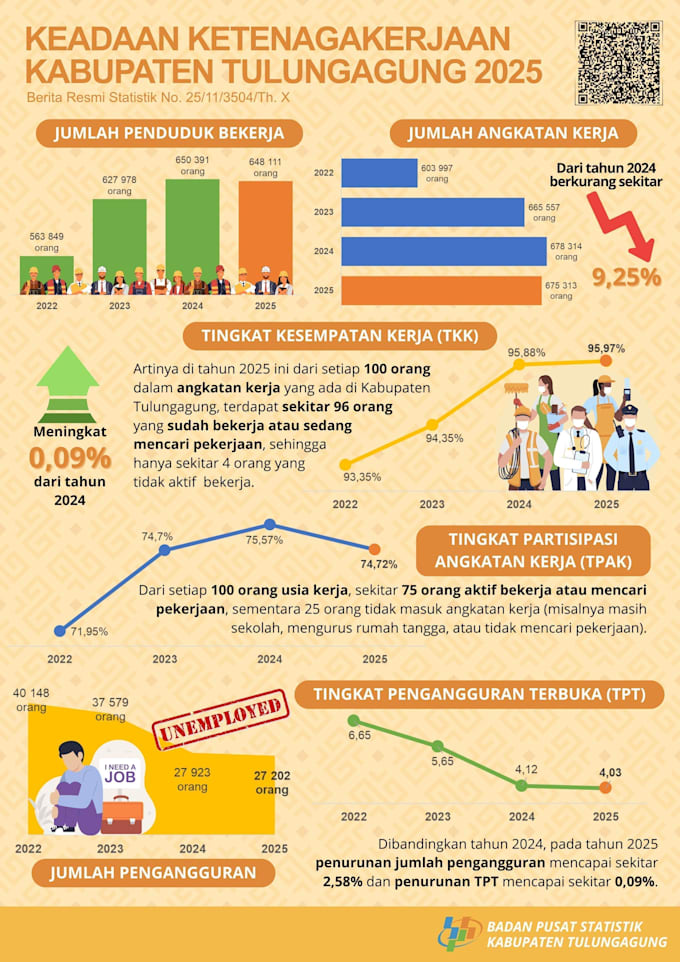
I will do statistical analysis, data visualization, and any other graphical design

A
addienasetiadi
A
addienasetiadi
Adin

About this gig

Transform Raw Data into Clear Insights & Stunning Visuals!

Messy spreadsheets or complex data you need to present with clarity? As a Statistician and Visual Communicator, I bridge the gap between rigorous statistical analysis and clean, functional graphic design. I turn raw numbers into high-impact visuals, polished reports, and ready to takeaways.


What I Offer ...

  • Data Cleaning & Prep : Structuring messy data and preparing files (.csv, .xlsx).
  • Statistical Analysis (EDA ): Descriptive stats, correlation, trend discovery, and hypothesis testing.
  • Data Visualization : High-res custom charts, graphs, and maybe dashboards.
  • Report & Deck Design : Professionally formatted slides, infographics, and summary layouts.


Why Choose Me?

  • Accuracy + Aesthetics: Get statistically correct findings paired with clean, modern visuals.
  • Clarity First: No visual noisejust clear, actionable data stories for your audience.
  • Branded Deliverables: Custom colors and fonts matching your style guide.


Have a custom dataset or unique workflow? Send a message to get started!

Get to know Adin

Adin

Statistical Analysis, Data Visualization, and Infographics

  • FromIndonesia
  • Member sinceAug 2026
  • Languages

    Indonesian, English
I am a statistician and data specialist with a knack for visual storytelling. My strength lies at the intersection of quantitative rigor and design aesthetics. I don't just crunch numbers and run statistical models, I transform raw, chaotic datasets into intuitive dashboards, meaningful charts, and clean visual assets. Whether you need deep data exploration, statistical analysis, or presentation-ready graphics to communicate your results to stakeholders, I bridge the gap between heavy data processing and clear, impactful design.