Browse categories
Explore
Fiverr Pro
English
$
USD


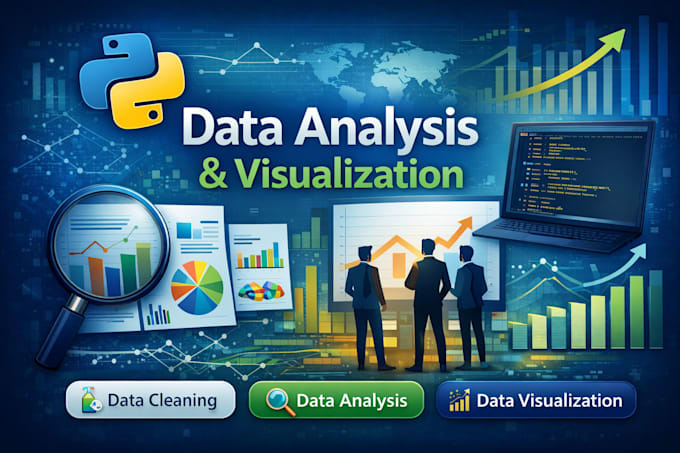
Turn your raw data into powerful and visually stunning insights!
I will create professional charts, graphs, and dashboards that make your data easy to understand and visually appealing.
Whether you have data in Excel, CSV, or other formats, I will organize and transform it into clear visualizations that help reveal important patterns and trends.
Clean and professional visuals
Easy-to-understand data insights
Fast and reliable delivery
Client satisfaction guaranteed
Perfect for business reports, presentations, and data analysis.
Feel free to contact me before placing an order so we can discuss your project and create the best visualization for your data.
Data analyst skilled in Excel, Python, SQL, and dashboards!
Languages
Q1: What types of data can you visualize?
I can visualize a wide range of data, including sales, finance, marketing, social media metrics, survey results, and real-time datasets.
Can you create interactive dashboards?
Yes! I can build interactive and dynamic dashboards that allow users to filter, drill down, and explore the data easily.
Do you provide data analysis along with visualizations?
Absolutely. I can provide insights, trends, and key takeaways from your data, not just charts and graphs.
What file formats will I receive the visualizations in?
You can receive visuals in formats like PNG, JPEG, PDF, Excel, or as live dashboards that can be shared online.
Which tools do you use for data visualization?
I use tools like Tableau, Power BI, Excel, Google Data Studio, and Python libraries such as Matplotlib, Seaborn, and Plotly, depending on your needs.