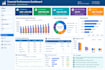
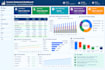
Excel Dashboard Design & Financial Reporting
I will create professional, interactive Excel dashboards that transform raw data into clear, actionable business insights.
My services include:
- Financial Dashboards: Profit & Loss, revenue, expenses, cash flow, and profitability analysis.
- Sales Dashboards: Sales performance, branch comparisons, product analysis, and sales trends.
- Accounting Dashboards: Accounts receivable, accounts payable, bank reconciliation, and expense tracking.
- Cost & Inventory Dashboards: COGS analysis, inventory monitoring, food and recipe costing, and cost variance analysis.
- Budget vs. Actual: Budget tracking, variance analysis, and performance monitoring.
- KPI Dashboards: Gross profit margin, net profit, sales growth, and other key performance indicators.
- Interactive Reports: PivotTables, PivotCharts, slicers, drop-down filters, and automated summaries.
- Data Automation: Excel formulas, data cleaning, dynamic charts, conditional formatting, and report templates.
What you will receive:
- A clean, professional, easy-to-use Excel dashboard.
- Accurate calculations and meaningful visualizations.
- Interactive filters for analyzing different periods, branches, or departments