Browse categories
Explore
Fiverr Pro
English
$
USD
I will help businesses with data, AI and career document services
Do you have messy, unstructured data? Or need help designing a UI with backend ML support?
With 5+ years of experience in Python, machine learning, and interface design, I provide complete data-driven solutions, including:
I use top tools like Tableau, Power Bi, PyCharm, Colab, Kaggle, and VS Code, and I offer multilingual support, unlimited revisions, and fast delivery.
Tool :


Can you create interactive charts or dashboards?
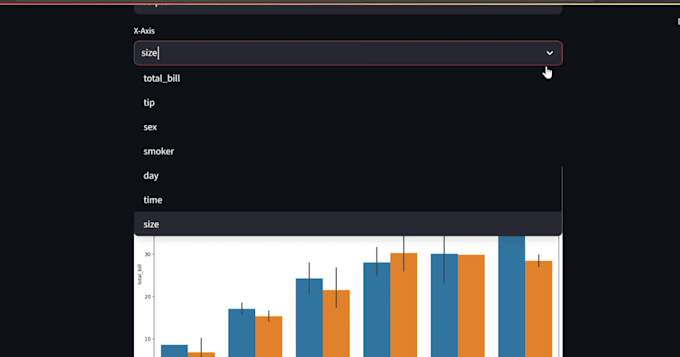
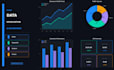
Yes! In Standard and Premium packages, I use Plotly, Streamlit, or Dash to create fully interactive visualizations and dashboards.
What information do I need to provide to get started?
Just share your dataset (Excel, CSV, or any format) and let me know what you want to visualize or analyze — charts, dashboards, trends, comparisons, etc. The more context you give, the better the output.
What tools and libraries do you use?
I work in Python using Matplotlib, Seaborn, Plotly, and Pandas. For interactive dashboards I use Plotly Dash or Streamlit. Final deliverables can be exported as PNG, PDF, HTML, or a live web app.
: My data is messy — can you still work with it?
Yes. Basic data cleaning is included in all packages. This covers handling missing values, fixing column types, removing duplicates, and structuring the data for visualization.
Will I receive the source code?
A: The Python script is included in Standard and Premium packages. If you're on Basic and want the code, you can add it as an extra for $15.
Q: Can I request a specific chart style or color scheme?
A: Absolutely. Share any reference images or brand colors and I'll match the style as closely as possible.
Q: What if I need changes after delivery?
A: Revisions are included based on your package (1 for Basic, 2 for Standard, 4 for Premium). Additional revisions are available for $5 each.
Q: Do you sign NDAs or keep my data confidential?
A: Yes. Your data is used solely to complete your order and is never shared with third parties. I'm happy to sign an NDA if required.
Q: How do I know which package is right for me?
A: Basic is ideal for a quick one-time chart or small dataset. Standard suits most projects needing a clean interactive dashboard. Premium is for full business reporting with insights and recommendations. If you're unsure, message me first and I'll suggest the best fit.