Browse categories
Explore
Fiverr Pro
English
$
USD


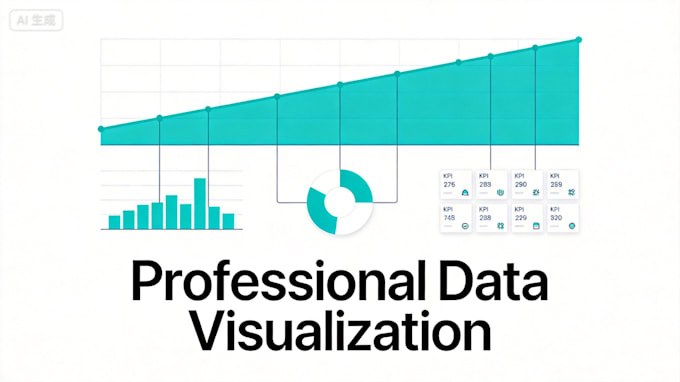
Transform raw data into stunning, publication-ready visualizations that make your insights impossible to ignore.
Numbers alone don't persuade visuals do. I create professional data visualizations, dashboards, and charts that turn complex datasets into clear, compelling stories your stakeholders will actually understand.
AI Powered Business Intelligence Analyst
Languages
What types of charts and visualizations can you create?What types of charts and visualizations can you create?
I can create bar charts, line charts, pie charts, scatter plots, heatmaps, radar charts, funnel charts, area charts, KPI dashboards, and more. Just share your data and I will recommend the best chart types for your story.
What format should my data be in?
Excel (.xlsx/.xls), CSV, Google Sheets, or even raw numbers in a message. Any structured data works — I will handle the formatting and visualization.
What file formats will I receive?
You will receive high-resolution PNG and PDF files. The Premium package also includes the editable source file so you can update charts anytime.
Can you match my brand colors and style?
Absolutely. Share your brand guidelines or hex color codes and I will apply them across all charts and dashboards for a consistent, professional look.
Do you offer revisions?
Yes — the Basic package includes 1 revision, Standard and Premium include 2. Additional revision rounds are available as an extra service.