Browse categories
Explore
Fiverr Pro
English
$
USD


Clear visuals turn raw data into meaningful insights and that's exactly what I help you create.
If you have a dataset and want to understand patterns, trends, or machine learning results, I will design clean, professional, and easy-to-understand data visualizations using Python. Whether you are a student, researcher, or working on an ML project, I ensure your visuals clearly communicate the story behind your data.
What I can help you with:
All visualizations are created using Python libraries such as Matplotlib and Seaborn, with a strong focus on clarity, readability, and correctness.
This gig is ideal for:
Important: Please contact me before placing an order so we can confirm your requirements. Large or complex visualization tasks may require a custom offer.
Data Scientist
Languages
Can I use these for presentations?
100% yes.
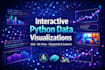
Do you create interactive plots?
Yes (based on requirement).
Do you help with university projects?
Yes, ethically and with explanation.
Do you work with large datasets?
Yes, message me for custom offers.


