Browse categories
English
$
USD
Connect to your AI
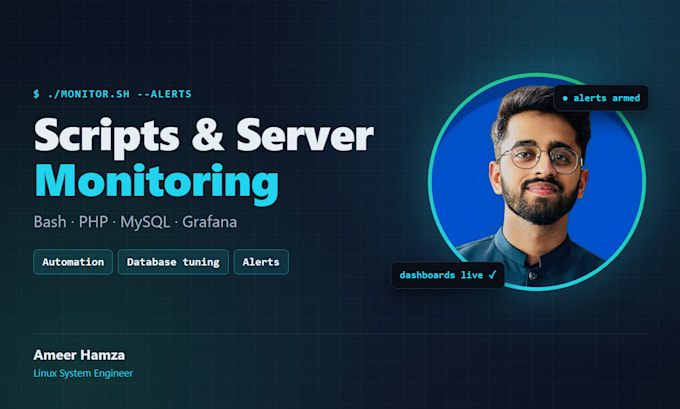
Linux System Engineer, Cybersecurity Expert, DevOps Specialist
Need to know a server is in trouble before your users do? I set up Grafana and Prometheus monitoring with clear alerts, and write Bash and PHP scripts that automate routine server work.
What I can do for you:
Grafana + Prometheus: exporters, dashboards and alert rules (email, Slack or Telegram)
Log monitoring with Grafana Loki or Graylog
Bash automation: backups, health checks, cleanup and deployment scripts
PHP scripts: fix, optimise or extend existing scripts
Databases: MySQL, MongoDB and Redis setup, tuning and replication checks
Why work with me: I'm a Linux System Engineer on an infrastructure team that runs 350+ production servers, and I have written and open-sourced Prometheus exporters with Grafana dashboards and alert rules. I've completed 66 orders on Fiverr with a 5-star average.
How I work: we agree what to monitor first, I take a backup before any change, and you get a short handover note explaining every dashboard, alert and script.
Message me with your server type and what you want to watch, and I'll suggest the right package.

Operating system:
Linux
•
Unix
What types of databases do you support?
I work with MySQL, Redis, and MongoDB, offering setup, optimization, and troubleshooting services.
Can you help automate tasks using Bash scripts?
Yes, I specialize in Bash scripting to automate server tasks such as backups, monitoring, and deployments.
How do Grafana and Prometheus help with monitoring?
Grafana provides a powerful visualization dashboard for server metrics, while Prometheus collects and monitors data, allowing you to stay on top of server performance and receive alerts for any issues.
Can you provide custom scripts for specific tasks?
Absolutely! I can develop custom Bash or PHP scripts tailored to your specific requirements.
