Browse categories
Explore
Fiverr Pro
English
$
USD

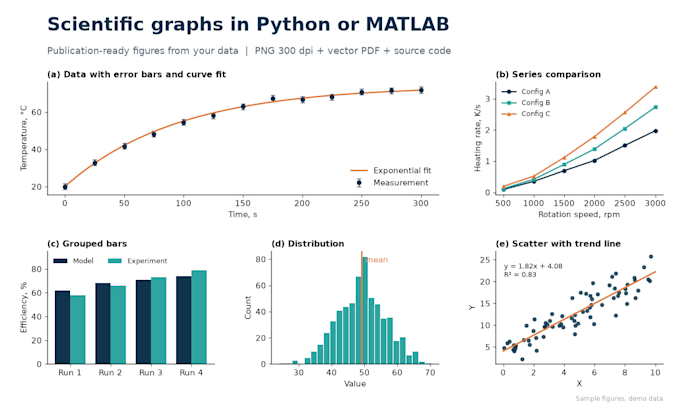
I am a physics researcher. I make graphs for my own journal papers, and I can do the same with your data.
What you get: up to 3 graphs in the basic order, made in Python (matplotlib) or MATLAB. Clear axes, units and legends, with fonts sized for a journal column. PNG at 300 dpi and vector PDF. The source code is included, so you can change the graph later.
What I need from you: your data as Excel, CSV or TXT, a short note on what each graph should show, and the journal or style requirements if you have them.
Good for line and scatter plots, bar charts, histograms, error bars, curve fitting, and several panels in one figure.
I do not write homework, coursework or thesis text for students. I only turn your own data into figures.
Please message me before ordering if your data is large or unusual.
AI Trainer and SubjectMatter Expert: Physics, Thermal Engineering, Mathematics
Languages
