Browse categories
Explore
Fiverr Pro
English
$
USD

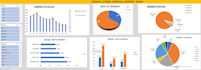

Do you need a clean, professional, and interactive way to track your sales, orders, and customer demographics? Look no further!
I will transform your messy spreadsheets into a visually stunning, fully interactive Excel dashboard just like the one featured in my portfolio image .
Whether you run an e-commerce store, a retail business, or need corporate reporting, I will help you see your data with total clarity.
What I Offer:
Interactive Dashboards: Built using Pivot Tables, Advanced Formulas, and Charts.
Dynamic Slicers & Filters: Filter your data seamlessly by Month, Channel, Category, or any custom metric.
E-commerce & Retail Insights: Custom tracking for Orders vs. Sales, Order Status (Delivered, Cancelled, Returned), Gender/Age demographics, and Top Performing States or Channels (Amazon, Flipkart, Myntra, Meesho, etc.).
Clean & Professional Layouts: Color-coordinated, executive-ready designs that look great during presentations.
Data Cleaning & Formatting: Organising your raw data so it calculates flawlessly.
Why Choose Me?
Tailored to Your Brand: I customize color palettes, charts, and metrics to match your business requirements.
Data Analysis and Management
Languages
Will I be able to update the dashboard with new data in the future?
Yes! I build dashboards using dynamic ranges and Pivot Tables. All you will need to do is paste your new raw data into the data sheet and click "Refresh."
What do I need to provide to get started?
Please provide your raw data file (Excel or CSV) along with a brief note on the key metrics (KPIs) you want to track or highlight.


