Browse categories
English
$
USD
Connect to your AI
Data Analyst and Business Intelligence Expert, Turning Data into Results
Welcome! Transform your raw data and messy spreadsheets into clear, intelligent decisions with professional data analysis, Big Data processing, and stunning visualizations.
What I Offer:
Data Cleaning: Handling missing values and restructuring datasets.
Advanced Analysis: Statistical modeling and trend discovery.
Big Data Processing: Efficient handling of large-scale datasets.
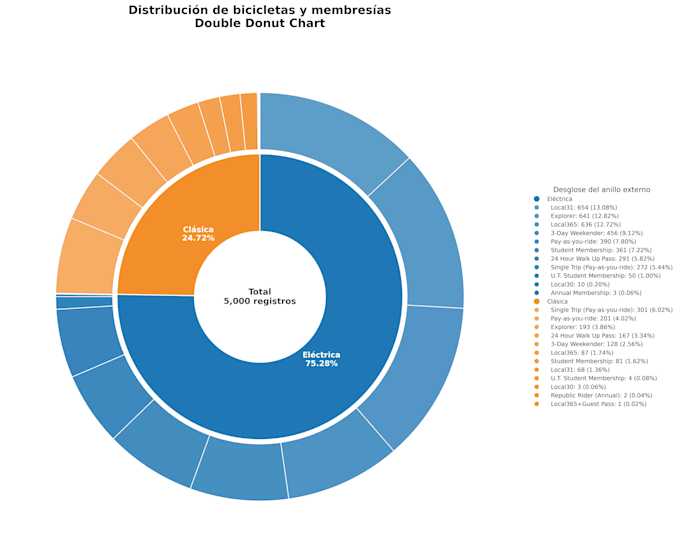
Power BI Dashboards: Modern, interactive business intelligence.
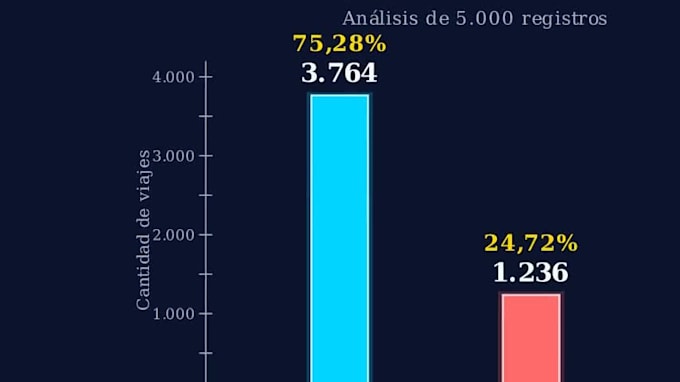
AI-Driven Insights & Animations: Dynamic charts that bring data to life.
Tech Stack: Python, Google Colab, Excel, Power BI.
Why Choose Me?
Professional and detail-oriented approach.
Fast delivery and clear communication.
Focus on high-value results.
Lets turn your data into your best asset. Message me to discuss your project!



• What software or tools do you use to clean and support the data pipeline?
• I primarily use Python (Pandas, NumPy, Plotly) for robust data cleaning, missing value imputation, and advanced analytics. For business dashboard support, I work with Power BI and Microsoft Excel. If your database requires specific SQL queries for extraction, I can handle that as well.
What happens if my dataset has critical errors or corrupted formats?
• Don't worry. Part of my core service is anomaly detection. If I find severe inconsistencies, corrupted columns, or missing metrics that impact your business goals, I will immediately message you with a clean diagnostics report and options to fix it before finalizing the analysis.
Do you offer post-delivery support if I find an issue with the clean data?
Yes, absolutely. I offer post-delivery technical support to ensure you can open, read, and utilize the clean dataset and video charts without any technical issues. Your package includes revisions to make sure the final output aligns perfectly with your original project requirements.
What business value do your dynamic video charts provide?
• Static reports often fail to show trends. My dynamic video charts (like animated bar chart races and timelines) capture the attention of stakeholders immediately. They make it easy for executives to visualize market growth, sales performance, or customer shifts over time in just a few seconds.