Browse categories
Explore
Fiverr Pro
English
$
USD
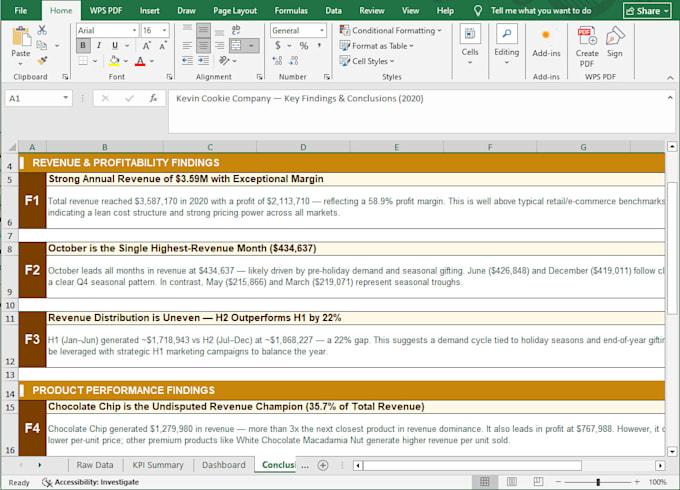
I will analyze and visualize your data in Excel and Python
Do you have data but struggle to turn it into clear, useful insights? I help you make sense of your numbers by combining Excels familiar interface with the power of Python for fast, accurate analysis.
With this gig, I can:
Packages are designed for different levels of depth:
You will receive well-structured Excel files so you or your team can keep using and updating the data easily. If you are not sure which package fits your needs, send me a message with your dataset and goals, and I will guide you to the best option.

1. What do I need to get started?
Please send your dataset (Excel/CSV), a brief description of your goal or questions you want answered, and any specific metrics or charts you need.
2. What types of data do you work with?
I work with business, sales, marketing, finance, operations, and general tabular data in Excel, CSV, or Google Sheets format.
3. How big can my dataset be?
Basic is for small datasets, Standard for medium, and Premium for larger or more complex datasets. If you’re unsure, send me a sample and I’ll guide you.
4. Which tools do you use?
I mainly use Excel for reports and dashboards, and Python (pandas, etc.) for cleaning, analysis, and automation where needed.
5. Do you accept custom requests?
Yes. If your project doesn’t fit exactly into a package, contact me with details and I’ll prepare a custom offer for you.