Browse categories
English
$
USD
Connect to your AI



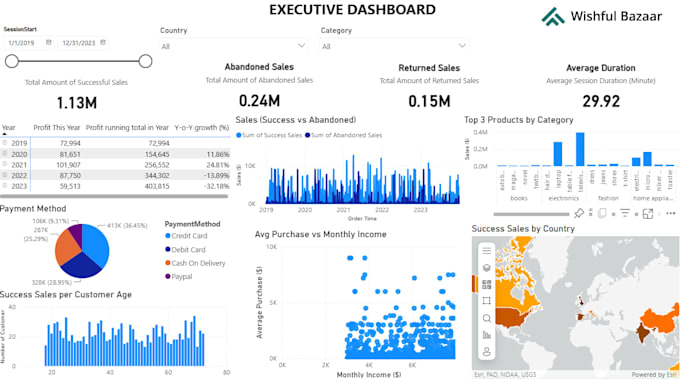
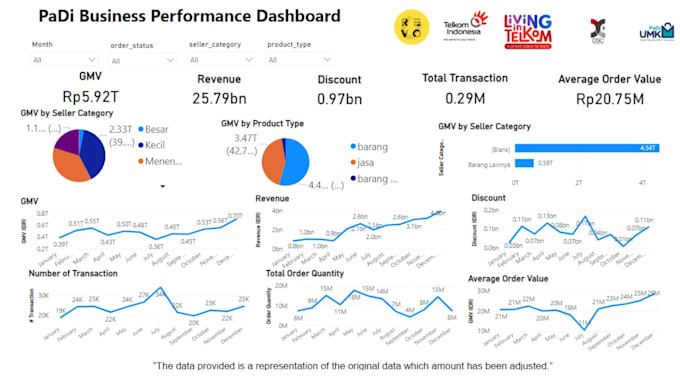
Still tracking performance in scattered Excel files and manual reports?
I will turn your raw data into a clear, interactive Power BI dashboard that shows your KPIs at a glance.
I am a Quality Manager with 15+ years in global consumer goods companies. I have built Power BI KPI dashboards that cut manual reporting effort by 75%, so I know which metrics matter for operations, quality, and production.
What you get:
Great for: quality KPIs (complaints, defects, CAPA), production performance, supplier performance, inventory, and operations reports.
What I need from you: your data file (Excel, CSV, or Google Sheets) and the KPIs you want to track.
Not sure if your data will work? Message me before ordering. Ill tell you whats possible, free of charge.
Power BI Dashboards Analyst
Languages
What types of data can you visualize?
I can visualize Excel, CSV, Google Sheets, and other structured datasets. Common use cases include sales, finance, operations, marketing, and business performance data.
What tools do you use for data visualization?
I can use Power BI for interactive dashboard visualization.
Can you recommend the right chart for my data?
Yes. I will select visualization types based on your data and the message you want to communicate, rather than simply turning every dataset into a chart.
Can you create dashboards as well as individual charts?
Yes. I can create individual charts, report-ready visualizations, or dashboards depending on your package and requirements.
Do I need to have a clean dataset?
Not necessarily. I can work with moderately unclean datasets and help identify formatting, missing-value, duplicate, or consistency issues. Extensive data cleaning may require an additional service.
Will you explain the insights from the visualization?
Yes. Depending on the package, I can provide a brief explanation of the key patterns, trends, or findings shown in the visualization.