Browse categories
Explore
Fiverr Pro
English
$
USD

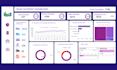
Most dashboards just provide a view; mine provide a vision. A cluttered report is just more noise, but a streamlined, interactive dashboard acts as a GPS for your business. I design tools that translate complex numbers into a clear narrative, allowing you to stop second-guessing and start leading with confidence.
You've found the solution youve been looking for.
What services you will get in this Gig:
Why Choose Me:
Place Order anytime I will Reply you soon as possible.
Thank you :)
Data Analyst and Data Visualization
Languages
What services do you offer in your gig?
I offer comprehensive statistical data analysis and visualization services using both Excel and Python.
What types of data can you analyze and visualize?
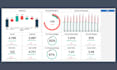
I can analyze and visualize various types of data, including numerical, categorical, time-series, and spatial data. Whether it's sales data, survey responses, financial data, or any other dataset, I can help derive meaningful insights from it.
Can you create custom visualizations according to specific requirements?
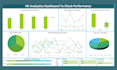
Absolutely! I can create custom visualizations tailored to your specific requirements and preferences. Whether you need bar charts, line graphs, scatter plots, heatmaps, or interactive dashboards, I can design visualizations that effectively convey the insights you seek.
Can you handle large datasets?
Yes, I have experience working with large datasets and can efficiently handle them using Python's libraries like Pandas and NumPy. These libraries allow for scalable data manipulation and analysis, ensuring timely delivery without compromising accuracy.
How do you ensure data confidentiality and privacy?
Your data will be handled with the almost with care and only used for the intended analysis purposes.
What are some common data visualization techniques in Excel?
Excel offers various chart types such as bar charts, line graphs, scatter plots, histograms, and pie charts for visualizing data.
| (0) | ||
| (1) | ||
| (1) | ||
| (0) | ||
| (0) |
cossol

Australia
Nice work - thank you
Up to $50
Price
3 days
Duration
amiralinoorani

Canada
Thank you for sending the work. I appreciate your time and effort which you put in this assignment.
Up to $50
Price
3 days
Duration

Seller's Response
| (0) | ||
| (1) | ||
| (1) | ||
| (0) | ||
| (0) |
cossol
Australia
Nice work - thank you
Up to $50
Price
3 days
Duration
amiralinoorani
Canada
Thank you for sending the work. I appreciate your time and effort which you put in this assignment.
Up to $50
Price
3 days
Duration
Seller's Response


