Browse categories
Explore
Fiverr Pro
English
$
USD
Operational Excellence
Are you looking for a dashboard to track Jira tickets, issue resolution, workload, and operational KPIs in one place?
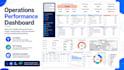
I will create an interactive Jira ticket resolution and KPI dashboard using Looker Studio, Excel, SQL, BigQuery, or Jira data to help you monitor ticket status, performance ratios, issue categories, customer/process trends, and resolution workload.
I can help you with:
With my background in Operational Excellence, Jira governance, KPI reporting, process improvement, and customer technical support, I design dashboards that are clean, practical, and useful for real operational decision-making.
Message me before placing an order so we can discuss your Jira workflow, KPIs, and dashboard requirements.



 _Dashboard_t7rofz.jpg)

Can you create a dashboard from Jira ticket data?
Yes, I can create dashboards using Jira exports, connected datasets, Excel/CSV files, SQL, BigQuery, or Looker Studio.
What ticket metrics can you track?
I can track ticket status, SLA, aging, resolution progress, issue categories, workload, bottlenecks, and performance KPIs.
Can you clean and prepare my data before building the dashboard?
Yes, I can clean, format, structure, and prepare your data to ensure accurate reporting and dashboard performance.
Can you add filters and calculated metrics?
Yes, I can add filters, scorecards, charts, calculated fields, performance ratios, and custom KPIs based on your workflow.
Do you provide documentation or guidance?
Yes, I can provide a simple user guide explaining the dashboard structure, filters, KPIs, and how to use the report.


