I will create charts, data visualizations, dashboards in excel
A
A
Medha K
Full Screen
Full Screen
Full Screen
About this gig
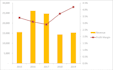
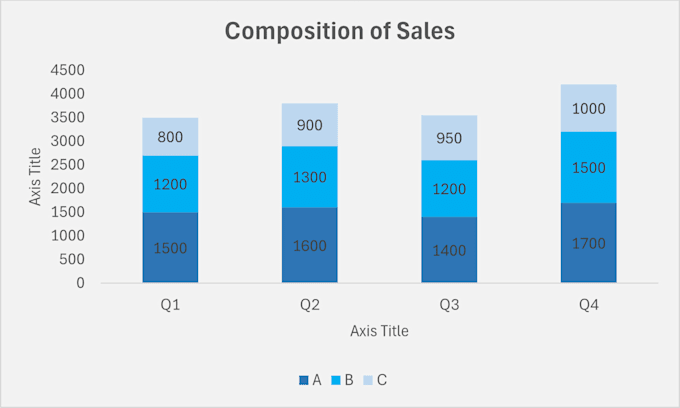
Graphical Presentation of Data using Excel, Google Sheets
Bar Diagram
Pie-Chart
Box Plot
Line Diagram
Histogram,
Scatter Plot
Dashboard
Tool
Excel
Chart type
Comparison
Distribution
Patterns
Relationship
Maps
Pie Chart
Other
Get to know Medha K
Medha K
Transforming Data into Actionable Business Insights
FromIndia
Member sinceAug 2017
Languages
Marathi, English, Hindi
Hi there! 👋 I’m a Senior Data Analyst with a strong background in Data Science and Applied Statistics. I help businesses make sense of their data and turn it into valuable insights that support smarter decisions.
🎓 Education:
M.Sc. in Data Science
PG Diploma in Applied Statistics with Software
B.Sc. in Statistics
💼 Here’s what I can do for you:
✅ Data Entry & Management
✅ Data Cleaning & Processing
✅ Data Analysis
✅ Survey Analysis & Interpretation
📊 Let’s collaborate and turn your data into powerful solutions.