Browse categories
English
$
USD
Connect to your AI


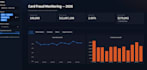
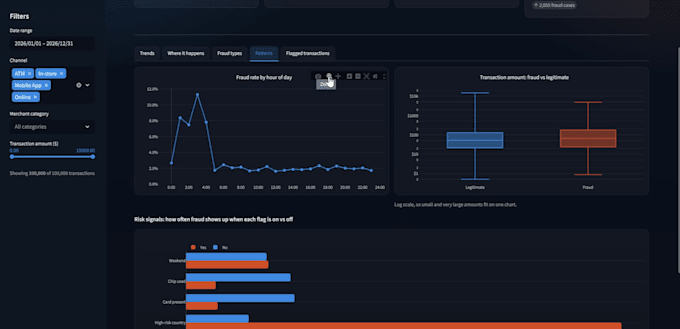
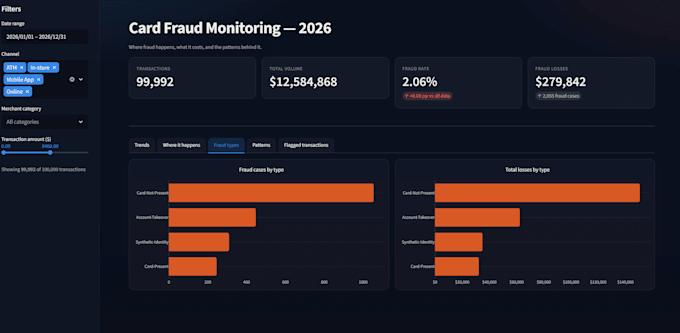
Got data in Excel or CSV that nobody looks at? Ill turn it into a clean, interactive dashboard in Python (Streamlit + Plotly).
You get:
I have a Bachelors in Data Engineering & AI and have built data pipelines and dashboards for university research projects.
Want to try a live demo? Message me and Ill send you the link.
Not sure which package fits? Message me first and Ill tell you honestly.
Languages
What formats do you accept
Excel, CSV and Google Sheets. For other formats, message me!!
My data is messy. Is that a problem?
No. Basic cleaning is included in every package. If it needs heavy restructuring, I’ll tell you before we start.
Do I get the source code?
Yes, full Python code with every order. It’s yours to keep and edit.
Can you build it in Power BI or Tableau instead?
This gig is for Python dashboards (Streamlit/Plotly). Message me if you’re unsure which tool suits you.
Is my data kept private?
Yes. I only use your data for your project and delete it after delivery if you ask.