Browse categories
Explore
Fiverr Pro
English
$
USD


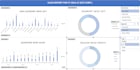
Excel Dashboard | Data Visualization | Reports | Charts
Do you want a clear and interactive Excel dashboard from your data?
I will create professional Excel dashboards that help you understand your data quickly and make better decisions.
Whether your data is messy or already structured, I can turn it into a clean and easy-to-use dashboard with charts, KPIs, and filters.
What I can do:
Tools:
Excel | Google Sheets
Note:
Please message me before placing an order so I can understand your data and requirements.
Transforming Data Into Clear Actionable Insights
Languages
What do you need from me to start the project?
I'll need your Excel or CSV data and a brief explanation of what you want to measure, such as sales, performance, or critical indicators.
Can I request changes after delivery?
Yes, one revision is available with the base package. I'm happy to make minor changes based on your input.
What type of dashboards do you create?
I create clean and simple Excel dashboards with charts, KPIs, and filters for easy data analysis and reporting.
