Browse categories
Explore
Fiverr Pro
English
$
USD


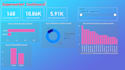

I'm a data visualization specialist who turns your raw numbers into clear, compelling visuals that drive insight and action. Whether you need a single chart for a report or a fully interactive dashboard for your website, Ill craft designs that highlight your story, not just your stats.
What you'll get:
Why choose me? I blend solid data-science principles with polished design every deliverable comes with up to three revision rounds (depending on package), fast turnaround, and clear documentation. Let's transform your data into a visual story that informs decisions and impresses stakeholders. Hit Order Now and let's bring your insights to life!
Designing, data visualization, QA and software testing, AI mobile app
Languages
Can you handle large datasets?
Absolutely. I can clean and sample large datasets for clear visuals or connect directly to your database to build live dashboards.
How do you protect my data confidentiality?
Your data is kept fully private. I’m happy to sign an NDA, and once the project is complete, I delete all raw data upon your request.