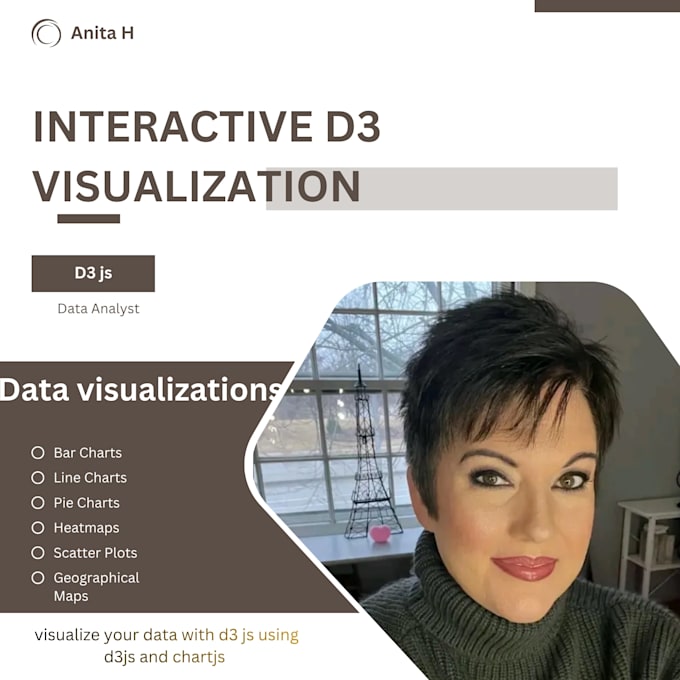
Unlock the power of your data with our exceptional data visualization services. Using D3.js and Chart.js, we create breathtaking, interactive visuals that bring your data to life in your browser.
Why Choose Me?
- Expertise in D3.js and Chart.js: We ensure your data is presented impactfully.
- Custom Designs: Tailored visualizations to tell your data's story.
- Interactive and Engaging: More than just static charts; we create interactive experiences.
- Fast Turnaround: Quick and efficient delivery of high-quality visuals.
What We Offer?
- Bar Charts
- Line Charts
- Pie Charts
- Heatmaps
- Scatter Plots
- Geographical Maps
- Custom Visualizations for your needs
How It Works
- Provide Your Data: Share your data in CSV or JSON format.
- Design and Development: We craft stunning visualizations.
- Review and Refine: You review, and we adjust.
- Final Delivery: Receive your interactive visualizations.
Lets Get Started!
Message me now to discuss your project and transform your data into compelling visuals. Experience the difference expertly crafted data visualizations can make!
Please message me before placing an order