Browse categories
English
$
USD
Connect to your AI
CAD, Data, Web
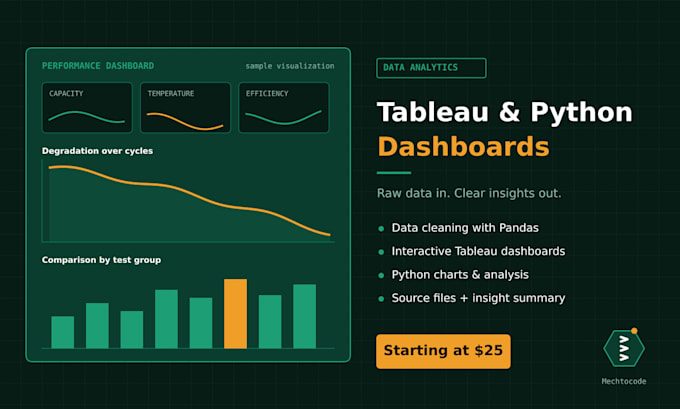
Have a messy spreadsheet and no idea what it's telling you? I turn raw data into clear charts and dashboards you can actually use.
I clean your data first (missing values, outliers, inconsistent formats in Pandas), then build visuals around the specific question you want answered.
What you receive:
- Cleaned dataset (CSV/Excel)
- Python charts or an interactive Tableau dashboard
- Source files (.ipynb or .twbx) + PNG exports
- Plain-language summary of key takeaways
My background & work:
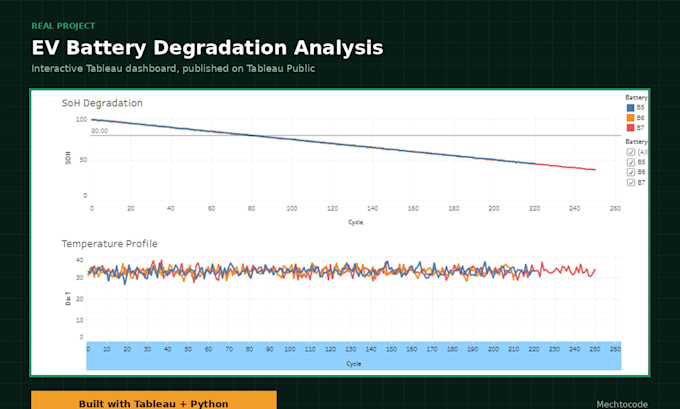
- Built an EV Battery Degradation dashboard in Python (Pandas) and Tableau tracking State of Health and temperature across charge cycles (see Gallery & PDF).
- Oracle Cloud Infrastructure 2025 Certified Data Science Professional & B.Tech Mechanical Engineering graduate.
- Processed 1,100+ articles as an AI Research Intern and completed Deloitte's Data Analytics virtual simulation.
Good for:
Business sales and operations data, engineering and EV test logs, research and survey datasets, or any static CSV/Excel file.
Tools: Python, Pandas, NumPy, Tableau, Excel, Jupyter.
Please message me before ordering with your file and goal so I can confirm scope and timeline first.


What file formats do you accept?
I accept static files in CSV, Excel (.xlsx, .xls), or TSV format. If your data is in another flat-file format, message me first so I can verify it in Pandas.
Do I need paid Tableau software to open the dashboard?
No. You can open the .twbx file using the free Tableau Reader app, or I can publish it to Tableau Public so it opens in any browser. I also include PNG screenshots in every package.
Is my data kept private?
Yes. Your dataset is used only for your project and never shared publicly unless you explicitly ask me to publish to Tableau Public. Tell me upfront if your data is sensitive.
Can you handle large datasets?
Yes. Pandas handles large files efficiently. Please message me with your approximate row count and file size before ordering so I can confirm the right package and timeline.
Do you build live database connections?
No, I work with static dataset exports (CSV or Excel files) rather than live database or API connections. Simply export a data snapshot from your system and send it over.