Browse categories
English
$
USD
Connect to your AI
Need help turning your Excel or CSV data into clear and useful insights?
I will clean, analyze, and visualize your data to help you understand important trends and patterns.
What I can help with:
Data cleaning and formatting
Exploratory data analysis
Statistical analysis
Data visualization and charts
KPI and business insights
Excel and CSV data analysis
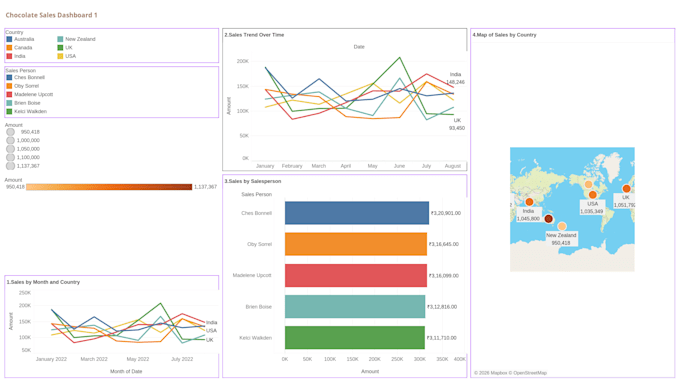
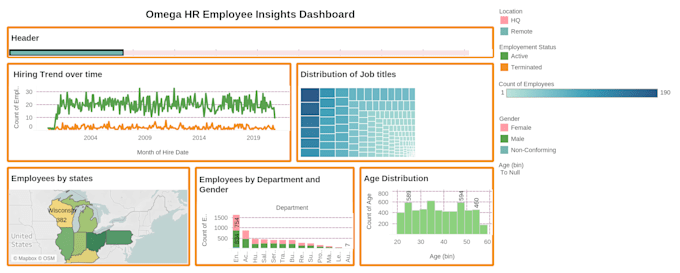
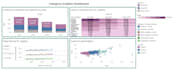
Tableau and Power BI visualizations
What you will receive:
Clean and organized data
Meaningful insights from your data
Clear visualizations and charts
Easy-to-understand analysis
Please contact me before ordering if you have a specific requirement or a large dataset.
Analysis type:
Quantitative Analysis
•
Descriptive Analysis
Expertise:
Business Insights
•
Anomaly detection
•
Statistics
Technology:
Excel
•
Power BI
•
Tableau
Programming language:
Python
•
SQL
What type of files can you work with?
I can work with Excel and CSV files. Please contact me before ordering if you have a different file format or a specific requirement.
What will I receive after the analysis?
Depending on the package you choose, you can receive cleaned data, data analysis, visualizations, key insights, and an executive summary.
Can you create dashboards?
Yes. I can create clear and interactive dashboards using Tableau or Power BI, based on your data and requirements.
Can you analyze large datasets?
Yes. Please contact me before ordering with details about the file size, number of rows, and your requirements so I can confirm the scope and delivery time.