Browse categories
Explore
Fiverr Pro
English
$
USD
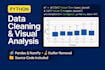
Python Data Analyst and EDA Specialist
Is your raw data messy, missing crucial values, or riddled with hidden outliers that skew your business metrics?
As a dedicated Data Analyst, I build Python data cleaning and EDA pipelines to transform messy datasets into structured, ready-to-use business assets.
With deep expertise in relational databases, mathematical anomaly detection, and visual debugging, I ensure your data tells an accurate story.
What I Will Do:
Why Work With Me?


Q: What do you deliver at the end of the project?
A: You will receive the fully cleaned dataset (CSV/Excel/SQL) along with a professionally structured, documented Python script (.py) or Jupyter Notebook (.ipynb) so you can run the pipeline again anytime.
Q: How do you decide whether to use IQR or Z-Score for my outliers?
A: I check your data distribution shape using .skew(). For normal (symmetric) distributions, I apply Z-Score. For skewed or non-normal data, I use the Interquartile Range (IQR) to avoid mathematical bias.


