Browse categories
Explore
Fiverr Pro
English
$
USD
Hi, I'm Arslan, your go to expert for statistical data analysis and clean, insightful visualizations.
With 5+ years of experience and a background in Computer Science, I help students, researchers, and businesses transform raw data into meaningful results. I specialize in statistical analysis and data visualization using tools like Python, SPSS, Excel, and more.
What I Can Do for You:
Run descriptive & inferential statistical tests
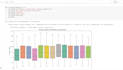
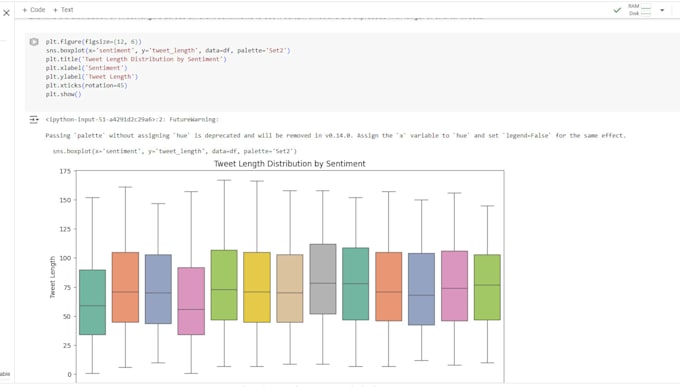
Build visualizations: bar charts, scatterplots, heatmaps, histograms, line graphs
Clean & analyze academic, business, or research data
Interpret survey results or experimental data
Deliver clear summaries, reports, and visual files (PDF, PNG, Excel, or code)
Tools I Use:
Python (Pandas, NumPy, Matplotlib, Seaborn, Plotly)
SPSS, R, Excel, Tableau, Power BI
Jupyter Notebook, Google Colab
Why Choose Me:
100% accurate analysis backed by experience
Charts & reports you can actually use
Friendly communication + revisions till you're happy
On-time delivery & full confidentiality
Not sure which package to choose? Message me your data and I will guide you in minutes.