Browse categories
Explore
Fiverr Pro
English
$
USD


Are you looking for professional data analysis and visualization using Python?
I will perform Exploratory Data Analysis (EDA) on your dataset and turn your raw data into clear, meaningful insights and visualizations.
What I can do:
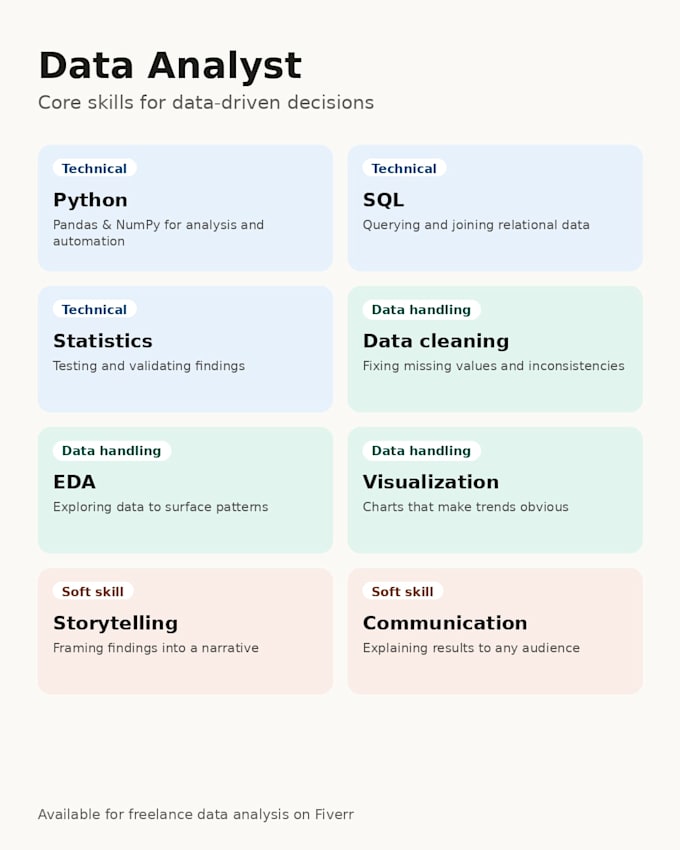
Data cleaning
Imputation, Deduplication ,Formatting ,Data types handling
Data preprocessing
Exploratory Data Analysis (EDA)
Missing-value and duplicate handling
Descriptive statistics
Outlier detection and handling
Correlation analysis
Data visualization using Matplotlib and Seaborn
Univariate analysis ,Bivariate analysis ,Multivariate analysis
Bar charts, line charts, histograms, scatter plots, box plots, heatmaps and more
Identify important patterns and trends
Provide clear insights from your data
Supported files:
CSV
Excel (XLS/XLSX)
Json
SQL (TEXT FILE)
Other common tabular datasets
You will receive a clean and well-organized Python/Jupyter Notebook along with visualizations and key findings.
Please contact me before ordering if you have a large or complex dataset so we can discuss your requirements.
Let's turn your data into useful insights!
Python Developer , Data Analyst ,Data Scientist
Languages
Q: What type of datasets can you analyze?
A: I can analyze common tabular datasets such as CSV ,Json and Excel files, including sales, customer, marketing, finance, survey, and other structured datasets.
Q: What is included in EDA?
A: EDA can include data cleaning, missing-value analysis, duplicate detection, descriptive statistics, outlier analysis, correlation analysis, visualizations, and key insights.
Q: Which Python libraries do you use?
A: I primarily use Pandas, NumPy, Matplotlib, and Seaborn for data analysis and visualization.
Q: Will I receive the Python code?
A: Yes. Depending on the selected package, you can receive a well-organized Python/Jupyter Notebook containing the analysis and visualizations.
Q: Can you analyze Excel files?
A: Yes. I can work with Excel files as well as CSV datasets.
Q: Can you create different types of charts?
A: Yes. Depending on your package and dataset, I can create charts such as bar charts, line charts, histograms, scatter plots, box plots, heatmaps, and other suitable visualizations.
Q: Can you handle missing values and duplicates?
A: Yes. I can identify and appropriately handle missing values, duplicate records, and common data-quality issues.
Q: Should I contact you before ordering?
A: If your dataset is large, complex, or has specific requirements, please contact me before ordering so I can confirm the scope and choose the appropriate package.