Browse categories
Explore
Fiverr Pro
English
$
USD

Level 1

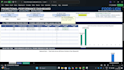


Need to know what is on track, what is slipping, and why?
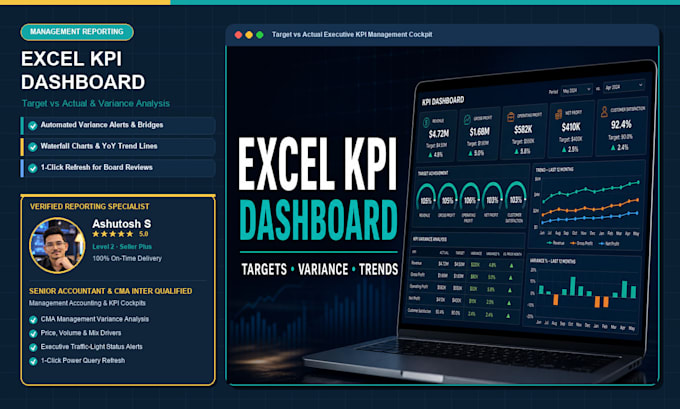
I am a Senior Accountant and CMA Inter Qualified with 8+ years of experience in management reporting. I build corporate Excel KPI dashboards that transform raw performance figures into clear Target vs. Actual variance views.
What You Get:
Why Work With Me?
My accounting background ensures practical reporting logicnot decorative filler. Formulas are clean, transparent, and structured for executive review.
Note: For company-wide dashboards, see my Interactive Excel Dashboard gig.
Send me your KPI list and sample data to get started!
Senior Accountant and CMA Inter Qualified, Financial Models and BI Dashboards
Level 1
Languages
How do I update the dashboard each month?
I build the workbook with a dedicated, clean "Data Input" tab or Power Query refresh pipeline. You simply paste your new monthly figures and click "Refresh All- all KPI cards, charts, and variances update instantly.
Can I track different types of KPIs (e.g. Sales, Financials, Ops)?
Yes. I design custom KPI views tailored to your exact business metrics: revenue targets, gross margins, customer acquisition costs, inventory turnover, employee productivity, or project completion rates.
Can the dashboard alert me when a KPI is below target?
Yes! I build conditional formatting indicators (Green = On Target, Yellow = Caution, Red = Critical Gap) so management can spot underperformance in seconds.
Will it work on both Windows and Mac Excel?
Yes, my KPI dashboards use native Excel dynamic formulas and standard slicers compatible with Microsoft 365, Excel 2016+, and Excel for Mac.
Can you connect the KPI dashboard to my accounting software or CRM?
Yes. Using Excel Power Query, I can connect the dashboard directly to CSV/Excel exports from QuickBooks, Xero, Salesforce, HubSpot, Stripe, or any database so that future monthly updates take just one click.
Can you calculate variance bridges (Price, Volume, Mix)?
Yes. In the Premium tier, I build automated variance bridge models that break down variance into revenue drivers (price changes vs volume sold vs product mix) or cost drivers, giving you complete FP&A insight.