Browse categories
Explore
Fiverr Pro
English
$
USD
AI ML Engineer and Web Developer with 18 Published Research Paper
Struggling to make sense of your data or need charts for your research?
I'll analyze your data and create stunning visualizations that tell a clear story.
NEW SELLER LAUNCH OFFER Research-grade quality at starter prices!
I'm a published researcher with 10+ papers in IEEE & Elsevier journals. I use
Python, Pandas, Matplotlib and Seaborn daily in my research the same tools
I'll use for your project.
WHAT YOU GET:
WHAT I CAN ANALYZE:
Sales & business data
Research & academic data
Survey results & statistics
Any CSV or Excel file you provide
HOW IT WORKS:
WHY TRUST ME?
Message me before ordering!
You have no reviews. How do I know your work is good?
My work is verified by 18+ published research papers in IEEE and Elsevier journals — you can check my Google Scholar profile right now. I perform data analysis daily in my research. Message me first and I will share sample charts from my published work. If you are not 100% satisfied I will redo free
What file format should I send my data in?
I accept CSV, Excel (XLSX/XLS), Google Sheets, or any plain text data format. If your data is in another format just message me — I can usually work with it.
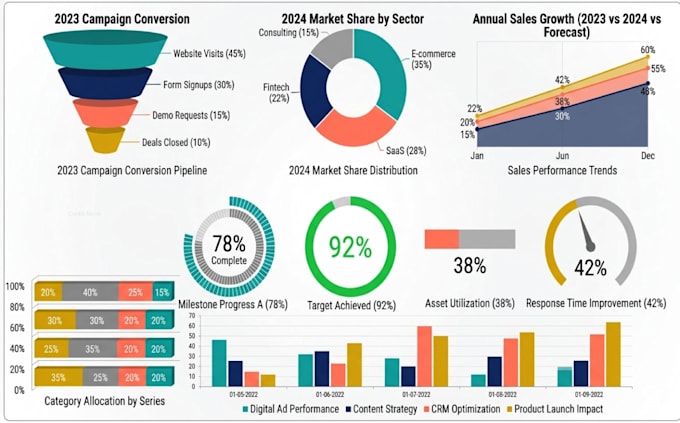
What types of charts and visualizations can you create?
I can create bar charts, line graphs, scatter plots, pie charts, heatmaps, box plots, histograms, correlation matrices, confusion matrices, ROC curves and more. If you need something specific just ask!
Can you create publication-ready figures for my research paper?
Yes! I create high-resolution figures (300 DPI+) ready for journal submission. I am familiar with IEEE, Elsevier and Springer formatting requirements from my own published work.
What files will I receive when the order is complete?
You will receive all chart images in PNG and PDF format, a written insights summary, and the cleaned dataset. Standard and Premium packages also include the full Python code so you can reproduce or modify the charts yourself.