Browse categories
English
$
USD
Connect to your AI

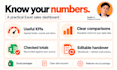

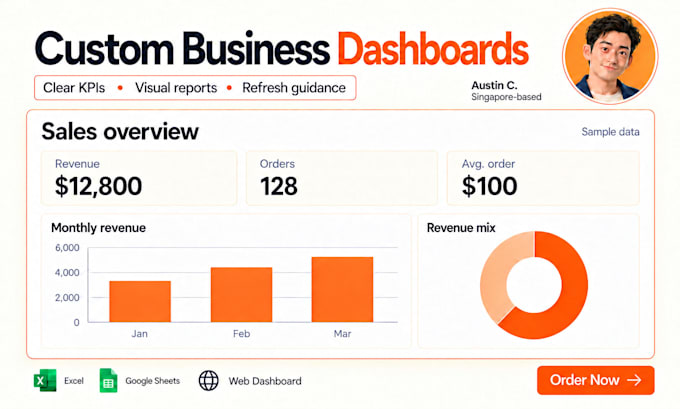
Know what sold, where revenue came from and which numbers need attention. I will turn your clean sales data into a focused Excel dashboard you can understand and update.
EVERY PACKAGE INCLUDES
- Agreed totals, counts or ratios and readable charts
- An editable workbook checked against source totals
- Clear instructions for replacing data and refreshing the report
Quick View: 3 KPIs and 2 charts for a small dataset.
Sales View: 5 KPIs, 4 charts and 1 filter.
Management View: 7 KPIs, 5 charts, 2 filters and 2 matching source files.
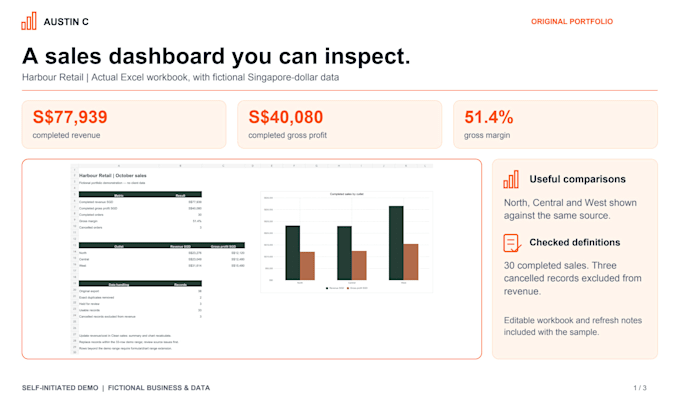
Explore the Harbour Retail portfolio for a genuine editable example with revenue, gross profit, margin and outlet comparisons. The business and data are fictional.
My background includes hands-on reporting, CRM and marketing operations. Send a sample and the business questions you need answered; you do not need to know Excel terminology.
Listed packages use clean, consistently structured Excel data. Substantial cleanup, complex financial models, live syncing, macros and forecasting are separate scope. Google Sheets requests need a compatibility check before ordering.
Excel dashboards, workflow automation and business websites
Languages
I do not know which KPIs to choose. Can you help?
Yes. Tell me the decisions you want to make and share a sample. We will agree useful measures and their definitions before work starts; no Excel jargon is required.
What data should I send?
A clean, consistently structured table with column headings. Send a sample first if you are unsure; substantial cleanup belongs in my separate cleanup gig.
Will the report update automatically?
I include instructions for replacing the source data and refreshing the workbook. Live connections and scheduled sync are not included.
Can I choose the KPIs?
Yes. We agree the KPI definitions and available source fields before work starts. I check the result against source totals.
Does this include Google Sheets?
The listed packages cover Excel. Send your Sheets requirements first so I can confirm compatibility and agree the scope.
What does a revision cover?
One consolidated round of changes within the agreed brief. New files, features, integrations or a changed brief require a separate scope.
What support is included?
Seven days after delivery to report defects against the agreed brief. New features, changed source formats and ongoing maintenance are not included.
Can you use confidential data?
Share only data you are authorised to provide. Anonymise samples where possible. I will agree any third-party or AI processing before sending your data to those services.
What KPI complexity is included?
Straightforward totals, counts and ratios from your available columns. We agree definitions first. Complex financial models, unrelated-table joins and forecasting need separate scope.