Browse categories
Explore
Fiverr Pro
English
$
USD


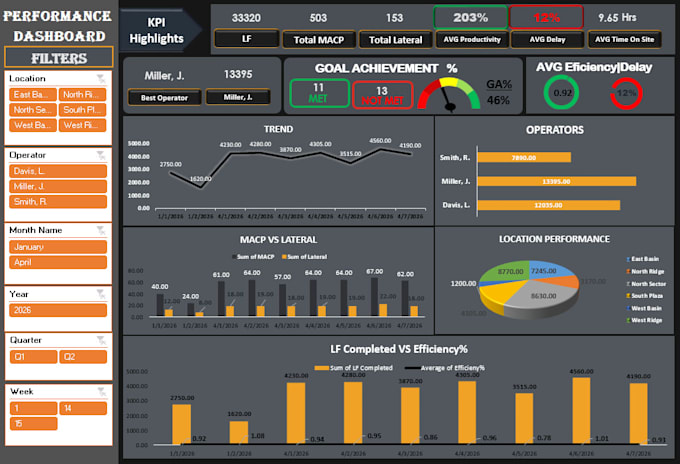
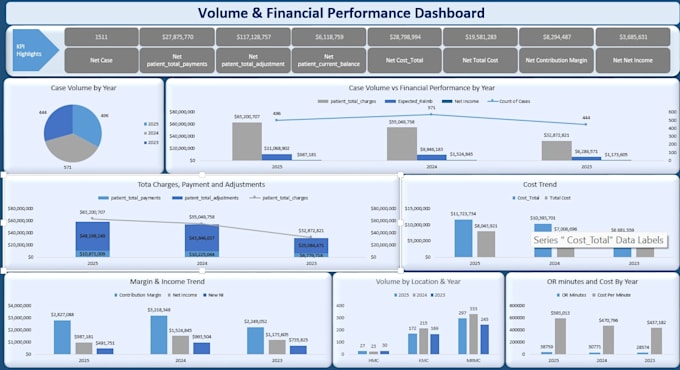
I will transform your raw Excel data into a clean, interactive, and professional dashboard that helps you understand your data and make better business decisions.
With advanced data visualization, KPI tracking, and dynamic charts, I create dashboards that turn complex data into clear and actionable insights.
I specialize in:
Every dashboard is designed to be visually clear, fully interactive, and business-ready.
Expert in Excek KPI Dashboard pivot table and formulas
Languages
Can you handle large or messy data?
Yes, I can clean, organize, and structure messy data before building the dashboard.
Will my dashboard be interactive?
Yes, I create fully interactive dashboards with slicers, filters, and dynamic charts.
Do you provide business insights or just visuals?
I provide both visual dashboards and basic insights to help you understand your data better.
What file format will I receive?
You will receive a fully editable Excel file (.xlsx).
Why should I choose you for my Excel dashboard project?
I focus on creating clean, interactive, and business-ready dashboards that turn raw data into meaningful insights. My work is designed to be both visually professional and easy to understand, helping you make better and faster decisions.