Browse categories
Explore
Fiverr Pro
English
$
USD
Google sheets expert and Data entry specialist
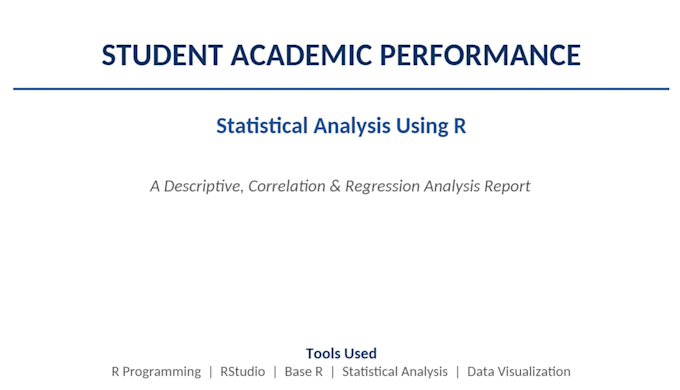
Struggling to make sense of your dataset, or need a clean statistical report for your thesis, coursework, or business decision? I provide full statistical analysis using R Programming and RStudio from raw data to a clear, well-documented set of findings you can actually use.
Using a real workflow (demonstrated on a 30-observation student performance dataset with Study Hours, Attendance, Sleep Hours, and Final Score), I deliver:
Descriptive statistics mean, median, spread, and variability for every variable, so you understand your data before modelling it.
Correlation analysis Pearson correlation with significance testing, showing which variables actually move together and how strongly.
Data visualization box plots, histograms, scatter plots, and correlation heatmaps that make patterns and outliers easy to spot at a glance.
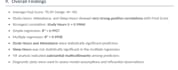
Simple & multiple linear regression full regression equations, coefficients, p-values, R² and adjusted R², so you know exactly how much of your outcome is explained by your predictors.
Residual analysis & diagnostics checking linearity, constant variance, and influential observations so the model's assumptions actually hold up.
Multicollinearity (VIF) analysis fl


Do you need my raw data, or can you generate a dataset?
I work with your data if you have it. If not, I can build a realistic sample dataset for demonstration or teaching purposes
Can you explain the results in simple terms, not just statistics jargon?
Yes — every deliverable includes a plain-language interpretation alongside the technical output.
What software do you use?
R and RStudio, using base R plus standard statistical and visualization packages.
Do you provide the R script/code along with the report?
Yes, on request — the commented R script is included so you can reproduce or extend the analysis.