I will interactive dashboards and data visualizations in python

A
aymen_watts
A
aymen_watts
Aymen W

About this gig

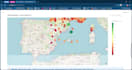
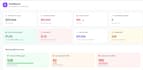
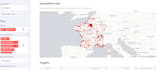
Turn your data into eye-catching charts and graphs!


Do you have data but don't know how to present it clearly? You're in the right place. I will create clean, professional, and easy-to-understand visualizations using Python to help you showcase your insights with confidence.


Whether it's for a business report, research project, presentation, or personal use, I'll transform your raw data into charts that are both informative and visually appealing.


What you can expect:

  • Professional-looking charts and graphs
  • Customized designs to match your needs
  • Fast delivery and clear communication
  • Python source code included
  • Attention to detail and quality results


No confusing visuals, no clutterjust clear data that tells a story.


Send me your data, and let's create something amazing together!

Get to know Aymen W

Aymen W

Finance Intern

  • FromFrance
  • Member sinceJun 2026
  • Avg. response time1 hour
  • Languages

    English, French, Spanish, Arabic, Chinese, Italian
I am a finance student with experience in portfolio management and quantitative analysis. I have developed automated data pipelines and financial models using Python and VBA to optimize multi-asset portfolios. My background includes international experience at Walt Disney World and a strong foundation in data analytics, financial valuation, and risk management.