Browse categories
Explore
Fiverr Pro
English
$
USD

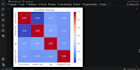
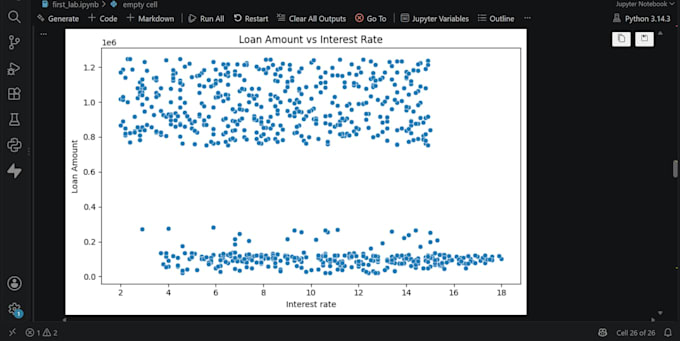
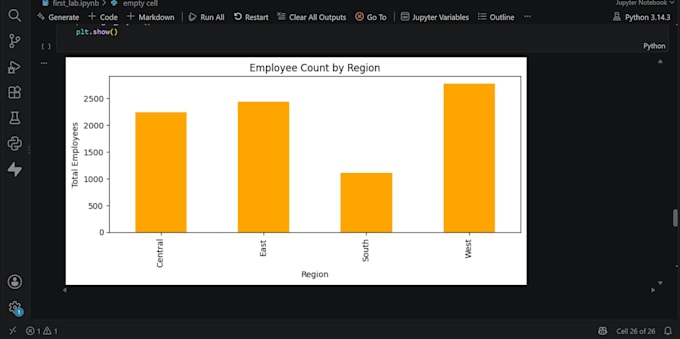
Do you have data but no clear way to show it? I will turn your spreadsheet into clean, easy-to-read charts.
What I will create:
- Bar, line, pie, and scatter charts
- Charts for reports, presentations, and assignments
- Clean labels, colours, and titles that make your data easy to understand
What you get:
High-quality chart images (PNG), plus the source file so you can edit them later.
What I need from you:
Your data file (CSV or Excel) and a short note on what story the charts should tell for example, sales over time, or a comparison between groups.
Packages: Basic covers 1 chart, Standard covers up to 5 charts, Premium covers up to 10 charts.
Fast delivery and clear communication. Message me before ordering if you're not sure which chart type fits your data.
Python Programmer for Data Cleaning, Automation and Visualisation
Languages
What format will my charts be in?
High-quality PNG images, plus the source file so you can edit them later.
What data do you need from me?
A CSV or Excel file, and a short note on what you want the charts to show.
Can you match my brand colours or style?
Yes — tell me your colours or share an example, and I'll match them.
What if I don't like a chart?
Revisions are included in every package — tell me what to change and I'll fix it.