Browse categories
Explore
Fiverr Pro
English
$
USD


Power BI Pipelines and Dynamic Reporting Dashboards
About This Gig:
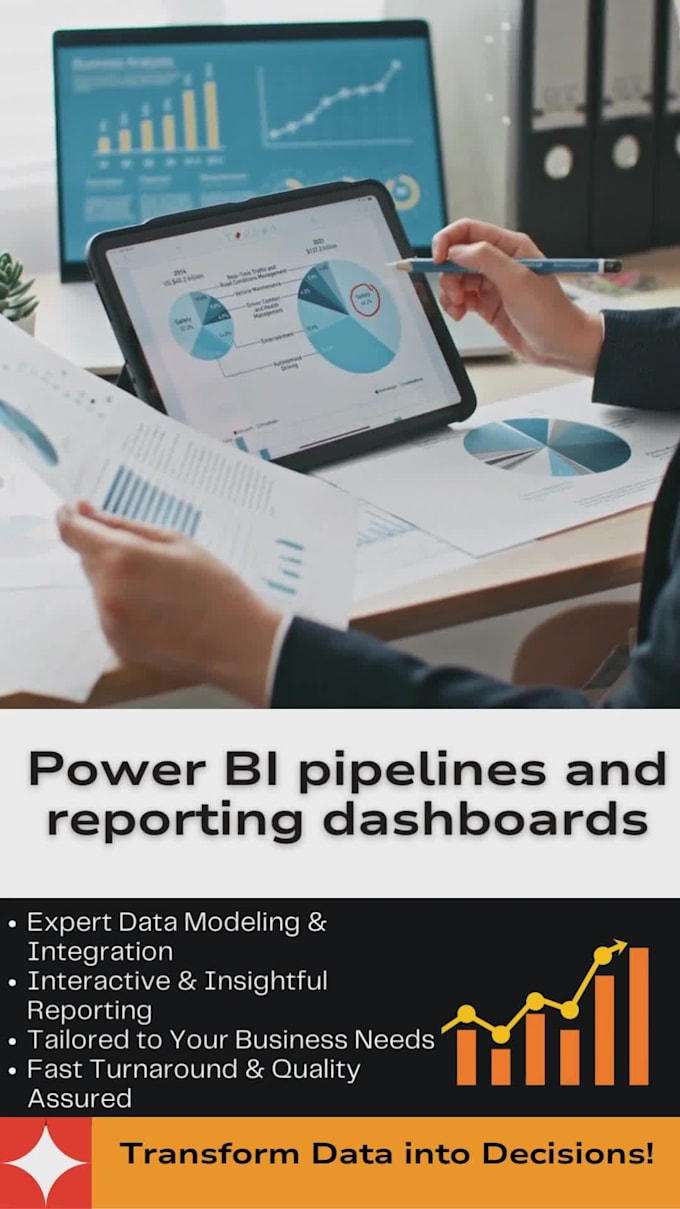
Get expert solutions in creating efficient Power BI pipelines and designing interactive, dynamic reporting dashboards. I specialize in turning complex data into clear, actionable insights with custom Power BI services tailored to your business needs.
What You Get:
Custom Power BI Pipelines for seamless data integration.
Interactive and visually engaging Power BI Dashboards.
Tailor-made solutions for real-time data insights and decision-making.
High-quality, precise Power BI services for businesses of all sizes.
Why This Gig:
Expertise in data analytics and visualization.
Commitment to quality, efficiency, and customization.
Ideal for enhanced data analysis and strategic decision-making.
Business Analyst
Languages
What range of visualizations can you create using Power BI for my specific business data?
I specialize in creating a wide range of visualizations using Power BI, including bar charts, line graphs, pie charts, and interactive maps. I tailor these visualizations to your business data, ensuring they are both informative and engaging.
How do you ensure the efficiency and accuracy of data pipelines in Power BI
In building data pipelines within Power BI, I focus on accuracy and efficiency. This involves cleaning, transforming, and integrating data from various sources to ensure seamless flow and accessibility of information for reporting.
Can you customize reporting dashboards to track specific metrics relevant to my industry
Absolutely, I customize reporting dashboards to track metrics that are vital to your industry. This involves understanding your industry's specific needs and incorporating relevant KPIs into the dashboard design.
What experience do you have in data analytics that can enhance the insights provided by Power BI dashboards?
My experience in data analytics allows me to extract meaningful insights from complex data sets. This experience enhances the value of the Power BI dashboards by providing deeper analysis and better context for decision-making.
How do you tailor data visualization in Power BI to suit different audience levels within my organization?
I design data visualizations in Power BI to cater to different audience levels. This means creating dashboards that are easily interpretable by non-technical users, while also providing in-depth analysis for more technical stakeholders.
Can you provide a custom Power BI solution for integrating data from multiple, disparate sources?
Yes, I offer custom Power BI solutions for integrating data from multiple sources. This involves creating bespoke data models that can handle and unify different types of data for comprehensive analysis and reporting.
How do you build Power BI dashboards that provide real-time insights and updates?
My Power BI dashboards are designed to offer real-time insights. I set up live data connections where possible, and use automated data refreshes to ensure you are always looking at the most current data.
What approach do you take to ensure Power BI dashboards effectively contribute to my business intelligence strategy?
My approach in Power BI dashboard creation is to align them with your overall business intelligence strategy. This involves understanding your business goals and data strategy to ensure the dashboards provide actionable insights.