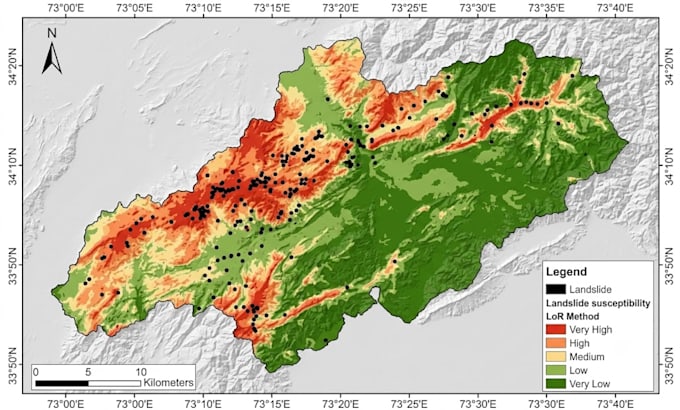
"Example of a predictive hazard model I generated using spatial data and the Logistic Regression (LoR) algorithm. This showcases my ability to process terrain data, apply statistical/machine learning models, and produce publication-ready risk maps for environmental management."
This map displays a Landslide Susceptibility Zone Analysis for a mountainous region, created using the Logistic Regression (LoR) method, a popular machine learning/statistical approach in GIS.
Key Features Shown:
- Landslide Susceptibility Levels: The map categorizes the terrain into five distinct risk zones based on color coding:
- Red (Very High) & Orange (High): Areas highly vulnerable to future landslide events, mostly concentrated along steep slopes and valleys.
- Yellow (Medium): Moderate risk zones.
- Light Green (Low) & Dark Green (Very Low): Safe, stable terrains.
- Landslide Inventory: The black dots/patches represent actual historical landslide locations, which are used to train and validate the predictive accuracy of the model.
- Cartographic Elements: Features standard map elements including a scale bar (in kilometers), orientation north arrow, and precise geographic coordinates (Latitude/Longitude grid.