Browse categories
English
$
USD
Connect to your AI


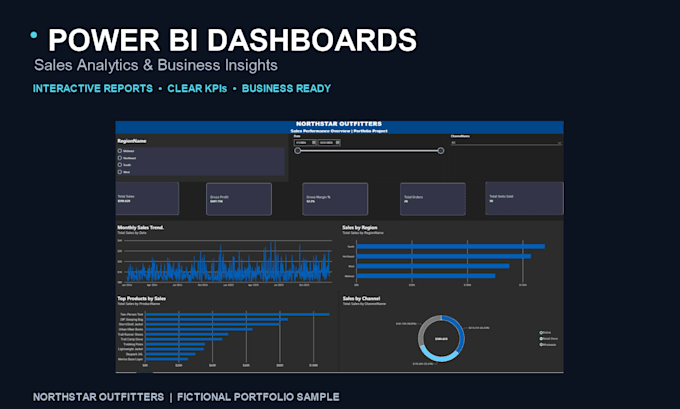
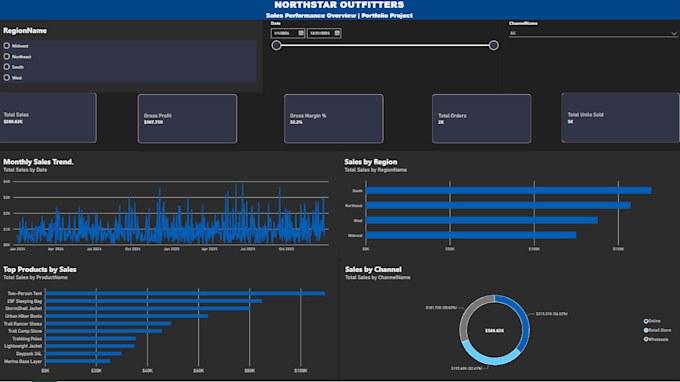
Need a clear, interactive Power BI dashboard to understand your business data?
I will create a clean and professional Power BI dashboard that helps you turn your Excel or CSV data into useful visual insights.
What I can provide:
Packages:
What I need from you:
Please provide your Excel or CSV file, explain what you want to measure, and share any preferred KPIs or examples.
I focus on clear visuals, organized layouts, and dashboards that are easy to understand.
If you have questions about your project or which package to choose, please contact me before ordering.
Data and AI Solutions
Languages
What do you need from me to start?
Please send your data file, the KPIs or metrics you want to track, and a brief explanation of your business goals. A reference dashboard is helpful but optional.
Can you clean my data before creating the dashboard?
This Gig focuses on dashboard creation using clean, prepared data. Please contact me first if your file needs significant data cleaning.
Can you create interactive dashboards?
Yes! I can create Power BI dashboards with charts, KPI cards, filters, and slicers, depending on your selected package.
What files do you accept?
I accept Excel (.xlsx, .xls) and CSV files. Please provide organized data and explain the main goals of your dashboard.