Browse categories
English
$
USD
Connect to your AI

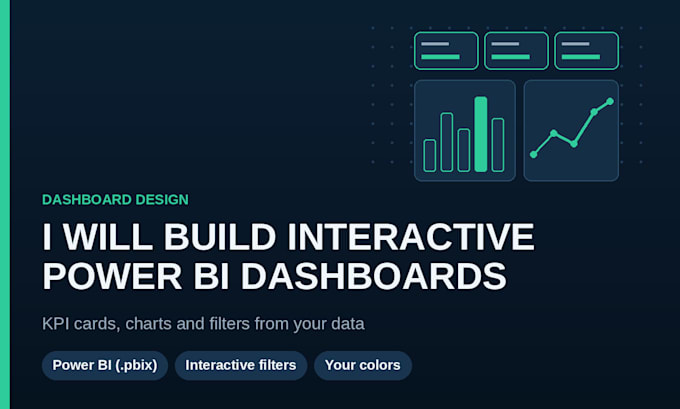
Turn your data into a clear, interactive dashboard. I design and build dashboards in Power BI (with DAX) that show your KPIs at a glance and let you explore the details. I'm a data analyst with 2 years of experience in SQL, Python, BigQuery and Google Sheets.
WHAT I CAN DO?
- Clean and model your data for reporting;
- Build KPI cards, trends, filters and drill-downs;
- Create DAX measures and calculated fields;
- Customer, risk and operations dashboards, including cohort and segmentation views;
- Connect your sources: CSV, Google Sheets and BigQuery.
WHAT DO YOU GET?
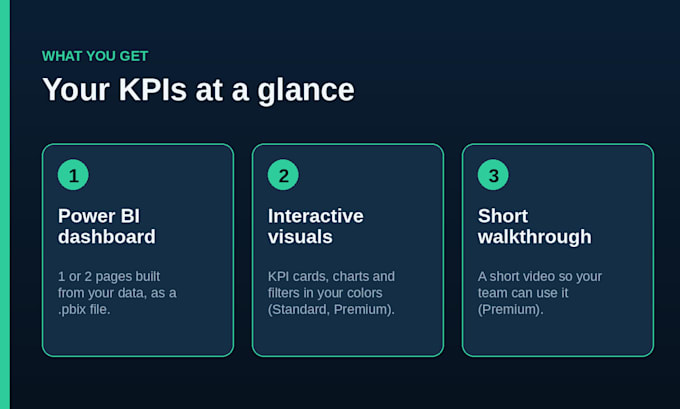
- A finished, interactive dashboard in Power BI;
- A clean layout in your colors;
- A short walkthrough so your team can use it.
My portfolio includes dashboards for customer segmentation, flight delays, loan default risk and music data. Send me your data and the questions you want answered, and I will confirm scope and timing before we start.
AI Model Evaluator and Data Analyst
Languages
Which tool do you use?
I build dashboards in Power BI and deliver a .pbix file you can open and edit.
What data formats can you work with?
CSV, xlsx and SQL databases.
Can you clean my data first?
Light cleaning is included. For larger or messier files, please check my Data Cleaning gig.
Can you match my brand colors?
Yes. Send me your colors or logo and I will apply them to the layout.
Do you publish the dashboard online?
I deliver the .pbix file and do not publish or embed it online. You can publish it from Power BI Desktop yourself.
What is included in the walkthrough?
A short video (Premium) showing how to use the filters and read each chart.