Browse categories
English
$
USD
Connect to your AI



I will build a browser-based HTML dashboard from your Excel or CSV data so you can track sales, operations or product KPIs.
You receive editable HTML, CSS and JavaScript, charts, filters, KPI definitions and instructions. Open the dashboard locally and load a new CSV with the same columns to refresh it. I will check the agreed calculations against your source.
Basic: 1 page, 3 KPIs, 3 charts, 1 filter; 1 clean table, up to 1,000 rows and 15 columns. Standard: 1 page, 6 KPIs, 5 charts, 2 filters; 1 clean table, up to 5,000 rows and 20 columns. Premium: 2 pages, 8 KPIs, 8 charts, 3 filters; 2 tables, up to 10,000 total rows, 25 columns per table and 1 join on an agreed key. Counts are totals per order.
Send a representative sample and the questions you need to answer before ordering. We will agree on metrics, rules and layout. Revisions cover the agreed scope. Data repair, APIs, live connections, hosting, logins and ongoing maintenance need a separate quote. Delivery is HTML source, not a Power BI PBIX or Excel dashboard.
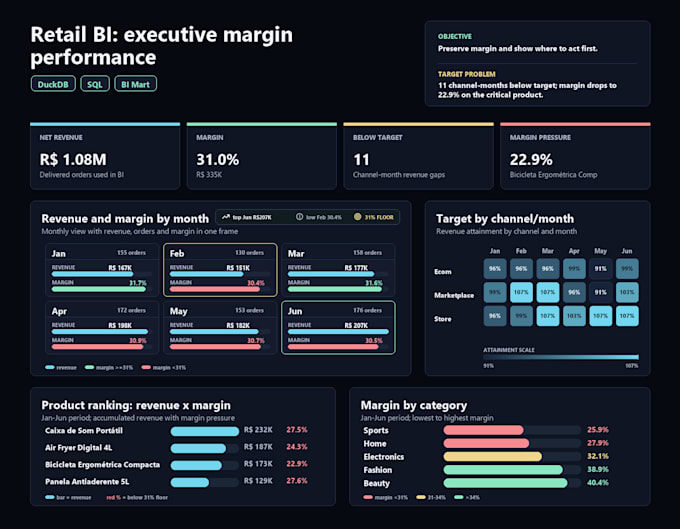
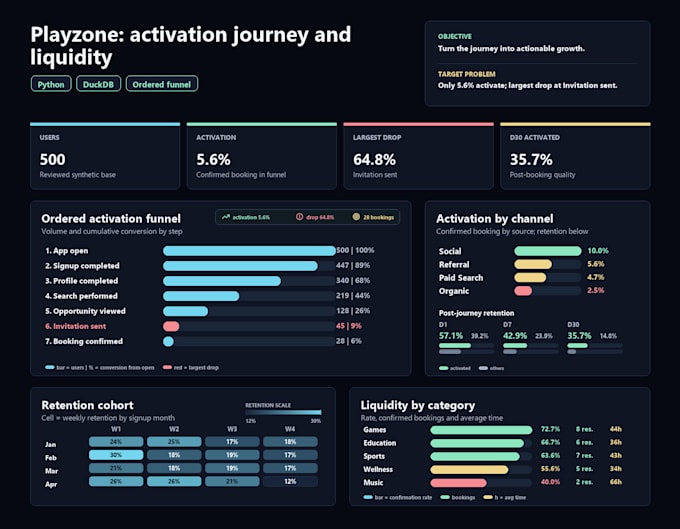
Gallery: portfolio studies with synthetic data, not client results.
Excel, Google Sheets, Presentations and Reports
Languages
What will I receive?
Editable HTML, CSS and JavaScript, the dashboard, KPI definitions and a short usage guide. The dashboard opens locally in a modern browser. This service delivers a web dashboard, not a PBIX or Excel dashboard file.
How do I update the dashboard?
Load a new CSV with the agreed column names and data types. I include a template and instructions. This is a manual file refresh; live Google Sheets, API and database connections require a separate quote.
What data can I send?
Send a representative Excel table or CSV, your metric definitions and the questions to answer. Basic and Standard cover one clean table. Premium allows two tables and one join on an agreed key. Row and column limits apply across the order.
Does the price include cleaning messy data?
Packages expect clean tables. I check types, required fields and the agreed calculations, and report issues. Large-scale cleanup, missing-data recovery or reconciling conflicting sources needs a separate quote before work starts.
What counts as a revision?
A revision adjusts the agreed labels, colors, layout or calculations. New metrics, sources, charts, pages or business rules change the scope and require a separate quote.
Are the gallery numbers real client results?
No. The gallery shows existing portfolio studies built with synthetic data for sales and product analysis. The samples demonstrate chart layout, KPI presentation and analytical structure; they do not represent client outcomes.