Browse categories
Explore
Fiverr Pro
English
$
USD


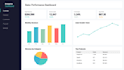
Your data is stuck in spreadsheets nobody reads. I'll fix that.
I build custom Streamlit dashboards that turn raw CSV, Excel, or database exports into live, interactive web apps no coding required on your end.
Built with Python, Plotly, and pandas. Every dashboard is deployable, documented, and yours to keep.
What you get:
- Interactive charts with filters, dropdowns, and date ranges
- KPI summary cards and trend indicators
- Clean, branded layout ready for stakeholders
- Fully documented Python source code
- Deployment instructions (Streamlit Cloud, Docker, or server)
Who this is for: sales teams, ops managers, founders, and analysts who want to stop emailing static Excel charts and start sharing a live dashboard link.
Why me:
- 11 open-source projects, 7,000+ automated tests production-grade code
- Full documentation with every delivery
- Avg. response time: 4 hours
To get started I need:
1. Your data file (CSV, Excel, or DB export)
2. 35 KPIs or metrics you want tracked
3. Any branding preferences (colors, logo)
Message me before ordering to confirm fit.
AI Engineer specializing in RAG, Chatbots, and Dashboards
Languages
What file formats do you accept?
I accept CSV, XLSX, XLS, JSON, and Google Sheets exports. Premium supports database connections (PostgreSQL, MySQL) and API integrations for live data.
How much data can you handle?
Basic: Up to 10,000 rows. Standard: Up to 100,000 rows with pagination. Premium: 1M+ rows with aggregation and server-side processing. Load time stays under 500ms.
Can you clean my messy data?
Yes! Data cleaning is included in all packages. I handle missing values, duplicates, format standardization, column renaming, and data type conversion automatically.
Will the dashboard work offline?
Yes! All dashboards are self-contained and run locally. No server required—just open in any browser. Premium adds option for local Streamlit deployment with Docker files included.
Can I update the dashboard with new data?
Basic: Send new files and I'll update (1 free update). Standard: I provide a simple updater tool. Premium: Self-updating dashboard that pulls from your data source automatically.
