Browse categories
Explore
Fiverr Pro
English
$
USD


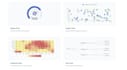
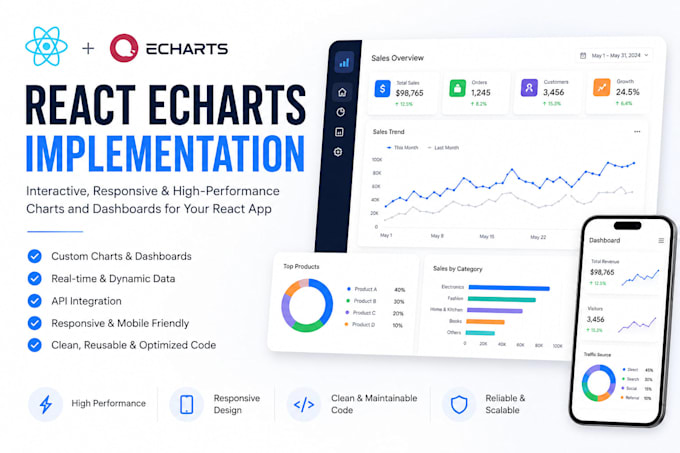
I will create high-quality, interactive data visualizations and dashboards using React and Apache ECharts. Whether you need simple charts or complex, real-time dashboards, I will deliver clean, responsive, and performant solutions tailored to your application.
What I can build:
This is ideal for analytics platforms, admin dashboards, SaaS products, and reporting tools.
Basic Single Chart
Standard Multiple Charts Dashboard
Premium Advanced Dashboard
Experienced Software Engineer
Languages
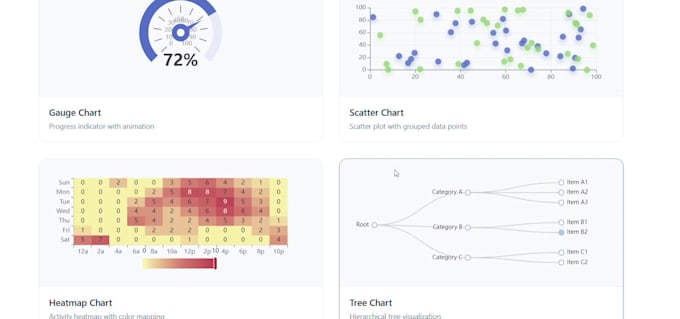
What kind of charts can you build?
I can build a wide range of charts, including line, bar, pie, area, scatter, heatmaps, and advanced visualizations using ECharts/ D3 Js.
Can you integrate charts into my existing React app?
Yes. I can seamlessly integrate charts into your existing React project and follow your current code structure and design system.
Do you support real-time or dynamic data?
Yes. I can connect charts to APIs or live data sources and update them dynamically in your React application.
Do I need to provide data?
Yes. You can provide API endpoints, sample JSON data, or dataset files. If needed, I can also create mock data for development.
Will the charts be responsive?
Yes. All charts will be optimized for different screen sizes including desktop, tablet, and mobile.
Can you create a full dashboard with multiple charts?
Yes. I can build complete dashboards with multiple charts, filters, and interactive components.