Browse categories
Explore
Fiverr Pro
English
$
USD
Fresher
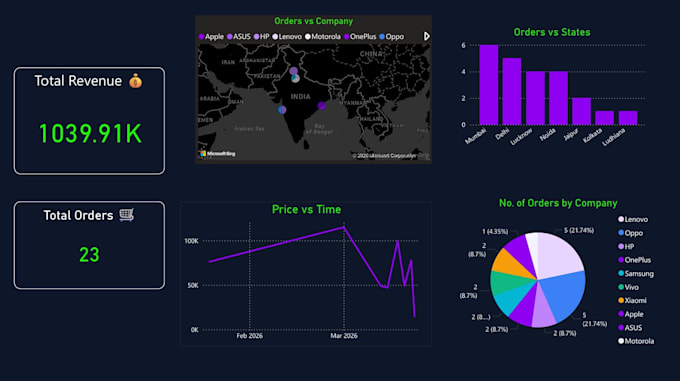
I create professional and interactive dashboards using Power BI, Tableau, and Excel to transform raw data into meaningful business insights. My work focuses on data cleaning, visualization, KPI tracking, trend analysis, and business intelligence reporting to help businesses make smarter decisions.
Services I Offer
I have worked on multiple real-world projects including Netflix analytics dashboards, hotel cancellation analysis dashboards, and eCommerce sales dashboards. These projects involved handling raw datasets, removing duplicates, managing missing values, analyzing business trends, and building professional visual reports.
I focus on creating clean, modern, and easy-to-understand dashboards with interactive charts and insights that help businesses monitor performance and understand their data more effectively. My goal is to convert complex datasets into visually appealing dashboards that provide actionable insights and support dat


Q1. What tools do you use for dashboard creation?
I use Power BI, Tableau, Excel, and Python for data analysis, visualization, and dashboard development.
Q2. Can you clean and organize raw data before creating the dashboard?
Yes, I can clean, organize, and preprocess raw datasets by handling missing values, duplicates, formatting issues, and inconsistent data.
Q3. What type of dashboards can you create?
I can create sales dashboards, business intelligence dashboards, KPI reports, financial dashboards, marketing analytics dashboards, eCommerce dashboards, and more.
Q4. Will the dashboard be interactive?
Yes, dashboards can include interactive filters, slicers, charts, graphs, and KPI tracking for better analysis and user experience.
Q5. Can you work with Excel, CSV, SQL, or online datasets?
Yes, I can work with Excel files, CSV datasets, SQL databases, and other structured data sources.
Q6. Do you provide insights and trend analysis?
Yes, I provide trend analysis, performance insights, and summary reports to help understand the data