Browse categories
Explore
Fiverr Pro
English
$
USD


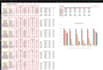
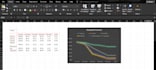
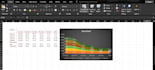

Need publication-ready scientific graphs for your manuscript, thesis, or presentation?
As a researcher with an academic background in Biotechnology, I turn raw lab data into high-quality, precise Excel charts tailored for journal submission and clear scientific presentation.
What I Offer:
Why Work With Me?
Have custom multi-panel figures or special requirements? Message me anytime before ordering!
Bridging Biotechnology Research with Clear Office Solutions
Languages
What file formats do I need to send you?
You can send your raw or processed data in Microsoft Excel (.xlsx, .xls), CSV, or Google Sheets formats. Please ensure your columns/rows are clearly labeled with units where applicable.
Can you apply specific formatting rules required by scientific journals?
Yes! If you are submitting to a specific journal (e.g., Nature, Science, Elsevier, ACS, Wiley), simply share the target journal’s figure guidelines (font type, size, dimension limits, and resolution requirements like 300+ DPI), and I will tailor the outputs accordingly.
Do you perform complex statistical analyses on raw data?
This Gig primary focuses on data cleaning, structuring, and visualization. If your raw data requires basic descriptive statistics (mean, standard deviation, standard error), I include that. For complex statistical modeling or hypothesis testing, please send me a message first to discuss scope.
Will I receive the original Excel file so I can edit the graphs later?
Absolutely! Depending on your chosen package, I provide the fully formatted Excel source workbook alongside high-resolution image exports so you retain full control over your figures.
What if I need custom color palettes or multi-panel composite figures?
I can create color-blind accessible palettes (e.g., Virdis, Color Brewer) and organize multiple plots into clean multi-panel layouts (Figure 1A, 1B, 1C). Drop me a message to discuss your layout preference.


