Browse categories
Explore
Fiverr Pro
English
$
USD
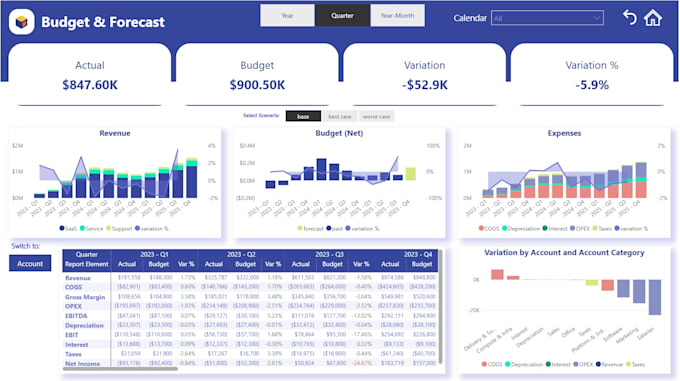
I build analytics and automation systems to grow your business
I help businesses turn their raw data into dashboards that actually make sense. Using Power BI, I create visuals that let you spot trends, track your KPIs, and make decisions without getting lost in spreadsheets.
Whether you just need a simple report to get quick insights or a full interactive dashboard ready for executives, Ill work with your data to build something practical, clear, and easy to use. My goal is to save you time and help your team make smarter decisions every day.
Want to see a demo?
https://app.powerbi.com/view?r=eyJrIjoiNWU2ODRlNjctZTQxZi00MmNmLThlNWEtNzdmZmEwOTFlZWI1IiwidCI6ImZhYTQ0NjI2LTc1YTEtNDZjMi1iNjNlLTM1ZDg3OWU0ZTA5ZCJ9&embedImagePlaceholder=true


What information do you need from me to get started?
I’ll need your data files (Excel, CSV, or database access), a brief description of the insights you want, and any specific KPIs or visuals you need included.
Can you connect multiple data sources?
Yes! The Basic package uses one data source, Standard supports up to 2, and Premium can handle up to 4 data sources.
How interactive will the dashboard be?
Standard and Premium dashboards include interactive features like filters, drill-through, and slicers, so you can explore your data dynamically.
Can the dashboard update automatically?
Yes! Standard and Premium packages include automated data refresh options if your data source allows it.
What if I don’t know which visuals I need?
No problem! I’ll help recommend the best visualizations based on your data and goals to make the dashboard as insightful as possible.
Can you make changes after delivery?
Yes, I offer post-delivery support to make small tweaks and ensure the dashboard works exactly as you need.