Browse categories
Explore
Fiverr Pro
English
$
USD
I build analytics and automation systems to grow your business
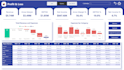
Gain a complete and interactive view of your organizations financial performance with our Dashboard. Consolidating the Profit & Loss, Balance Sheet, and Cash Flow statements in a single, dynamic interface, this dashboard allows you to track financial performance, monitor budget deviations, and uncover trends at a glance.
Key features include:
Demo?
https://app.powerbi.com/view?r=eyJrIjoiNWU2ODRlNjctZTQxZi00MmNmLThlNWEtNzdmZmEwOTFlZWI1IiwidCI6ImZhYTQ0NjI2LTc1YTEtNDZjMi1iNjNlLTM1ZDg3OWU0ZTA5ZCJ9&embedImagePlaceholder=true
What financial statements are included in this dashboard?
The dashboard consolidates the three core financial statements: Profit & Loss (P&L), Balance Sheet, and Cash Flow, providing a complete view of your company’s financial health.
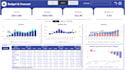
Can I compare actual results to my budget?
Yes! The dashboard includes a Budget vs Actual variance analysis, so you can quickly identify areas where performance deviates from expectations.
How far back can I see historical data?
The dashboard can display multiple years of historical data, depending on the package you select, allowing trend analysis and year-over-year comparisons.
Do I need any special software to use it?
You’ll need Power BI (Desktop or Pro) to access and interact with the dashboard. We provide the model and instructions for smooth setup.
Will I get support to understand the dashboard?
Yes. Consultation sessions are included depending on your package, where we walk you through the dashboard, methodology, and insights.
Is the data refreshed automatically?
The dashboard can be configured to refresh automatically if connected to your data sources, ensuring your metrics are always up to date.
Can I customize the KPIs or visuals?
Yes, the dashboard is designed with flexibility in mind. We can help adjust KPIs or visuals based on your reporting needs during the setup and consultation sessions.


