Browse categories
Explore
Fiverr Pro
English
$
USD


Need a Power BI dashboard that turns your data into actionable insights?
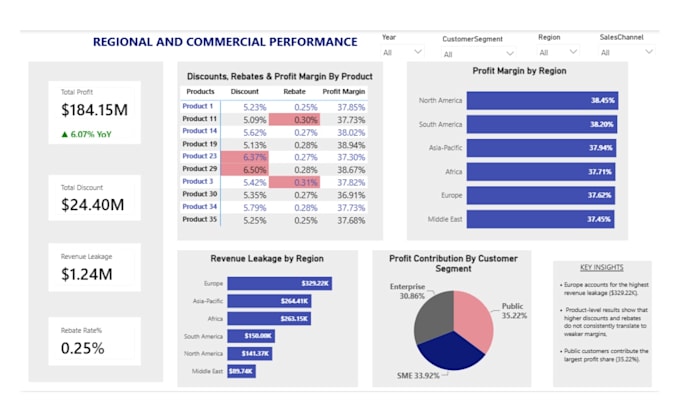
I create interactive Power BI dashboards and reports to help you track KPIs, monitor performance, spot trends, and make informed decisions.
Working with Excel, CSV, SQL databases, Google Sheets, and other supported sources, I turn your data into clear, easy-to-use reports.
What I Offer:
Why Work With Me?
I'm a Data Analyst with experience in business operations and healthcare. I build accurate, user-friendly dashboards that answer your reporting questions, not just display charts.
What You'll Receive:
An interactive report tailored to your package and agreed requirements, plus the editable Power BI (.pbix) file.
Not Sure Which Package Fits?
Message me with your dataset and reporting goals before ordering. I'll help you choose the right package.
Business Intelligence and Healthcare Data Analyst
Languages
What data sources can you connect to the dashboard
I can work with Excel, CSV files, SQL databases, Google Sheets, and other Power BI-supported data sources. I can also combine multiple sources when needed. Please message me before ordering if your project requires multiple connections or a specialized data source.
Do I need a paid power BI license to use it ?
No! You can view and interact with the file completely using Power BI Desktop. If you share it online with a large team, Pro license may be required
Can you work with messy data?
Yes! I can clean and organize data with issues like duplicates, missing values, inconsistent formatting, and incorrect data types using Power Query. Basic cleaning is included in my packages, but complex data cleaning may require a custom offer. Please contact me before ordering if your dataset need
What's the difference between your Basic, Standard, and Premium packages?
Basic includes a 1-page Power BI report with up to 4 charts and 3 KPIs. Standard offers up to 2 pages, 8 charts, and 5 KPIs. Premium includes up to 4 pages, 12 charts, and 8 KPIs, with more advanced data modeling. All packages include interactive visuals and data cleaning appropriate to the scope.
Can you customize a Power BI dashboard to my specific requirements?
Absolutely! I can customize your Power BI dashboard to match your reporting goals, preferred KPIs, and visual layout. Whether you need sales, healthcare, financial, or operational reports, message me with your requirements before ordering so we can agree on the scope, timeline, and price.