Browse categories
Explore
Fiverr Pro
English
$
USD


Ready to turn your data into insights? Contact me today, and lets build a dashboard to elevate your business!
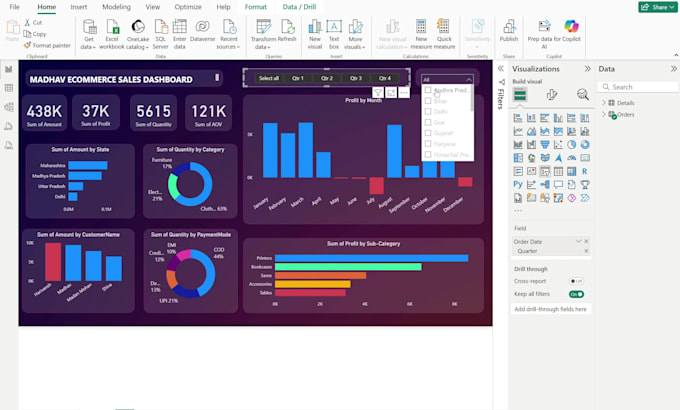
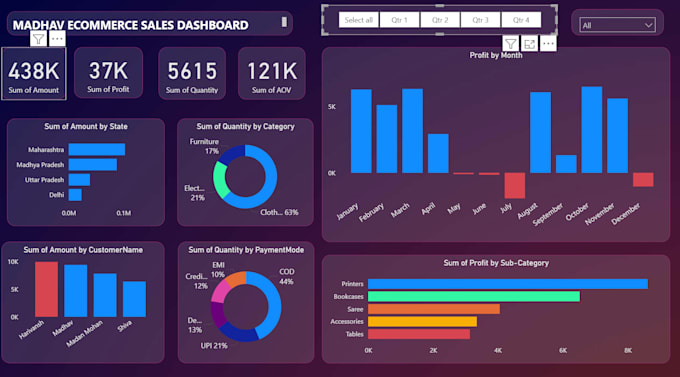
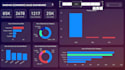
I'm Danesh Kumar, a Data Analyst with expertise in Power BI, Excel, and SQL, dedicated to helping businesses make confident, data-driven decisions. I specialize in crafting custom dashboards and reports tailored to your KPIs and goals, transforming raw data into actionable insights.
What I Offer:
Data Sources I Work With:
️ Tools I Use:
Power BI, Excel, SQL, Python.
Why Choose Me:
Favorite Quote: "Early Bird Gets the Worm."
Your data has a story, I help it speak!!
Languages
What do you need from me to get started?
To begin, I’ll need your dataset (Excel, CSV, SQL, Google Sheets, etc.), a brief on what you want to visualize, and any KPIs or metrics you want in the Power BI dashboard.
Can you handle messy or unstructured data?
Absolutely! I specialize in data cleaning and modeling, so even if your data is unorganized, I can prepare it for accurate and meaningful visualizations using DAX and Power BI tools.
Will the dashboard be interactive?
Yes, all dashboards are fully interactive. I use filters, slicers, drill-throughs, and cards to create engaging Power BI dashboards and Excel dashboards that are easy to use and interpret.